The Aging Aorta: Quantifying Age-Related Increases in Aortic Stiffness and Young's Modulus for Research and Therapeutic Development
This comprehensive review synthesizes current research on the progressive increase in aortic Young's modulus with aging.
The Aging Aorta: Quantifying Age-Related Increases in Aortic Stiffness and Young's Modulus for Research and Therapeutic Development
Abstract
This comprehensive review synthesizes current research on the progressive increase in aortic Young's modulus with aging. It explores foundational biomechanical principles and pathophysiological drivers, critically analyzes in vivo and ex vivo measurement methodologies, addresses common experimental challenges in data acquisition and modeling, and validates findings through cross-method and cross-species comparisons. Tailored for researchers, scientists, and drug development professionals, this article provides a critical framework for understanding aortic stiffening as a central biomarker and therapeutic target in age-related cardiovascular disease.
The Biomechanics of Aging: Defining Aortic Young's Modulus and Its Pathophysiological Drivers
Within the study of vascular aging, the aorta undergoes profound structural and functional changes. Central to quantifying this age-related decline in aortic compliance is the measurement of arterial stiffness. While several clinical indices exist (e.g., pulse wave velocity, augmentation index), Young's Modulus (E) remains the gold standard metric for researchers. It directly measures the intrinsic elastic properties of the vessel wall material, independent of geometry, providing a fundamental parameter for mechanistic research and therapeutic target validation in drug development.
Theoretical Foundation: Young's Modulus in Arterial Mechanics
Young's Modulus is defined as the ratio of stress (force per unit area) to strain (relative deformation) in the linear elastic region of a material's behavior. For a blood vessel, this translates to the stiffness of the wall material itself.
Formula: ( E = \frac{\sigma}{\epsilon} = \frac{(Pi - Po) \cdot ri}{h \cdot (\Delta r / ri)} ) Where:
- (\sigma) = Circumferential stress
- (\epsilon) = Circumferential strain
- (P_i) = Intraluminal pressure
- (P_o) = Extraluminal pressure
- (r_i) = Internal radius
- (h) = Wall thickness
- (\Delta r) = Change in radius
The relationship between key arterial stiffness metrics is defined in the following table:
Table 1: Core Metrics for Quantifying Arterial Stiffness
| Metric | Symbol | Definition | Units | Key Limitation |
|---|---|---|---|---|
| Young's Modulus (Incremental) | (E_{inc}) | Stress-Strain ratio in the physiological pressure range. | Pa, MPa | Requires precise geometric and pressure measurement. |
| Pulse Wave Velocity | PWV | Speed of pressure wave propagation along an artery (Moens-Korteweg: (PWV = \sqrt{\frac{E \cdot h}{2 \rho \cdot r_i}})). | m/s | Depends on both material (E) and geometry (h, r). |
| Compliance Coefficient | CC | Absolute change in lumen area per unit pressure change (( \Delta A / \Delta P)). | mm²/kPa | Heavily geometry-dependent. |
| Distensibility Coefficient | DC | Relative change in lumen area per unit pressure change (( (\Delta A/A) / \Delta P)). | kPa⁻¹ | Less geometry-dependent than CC, but not a material property. |
Methodological Guide: Experimental Protocols for Ex Vivo Assessment
Ex vivo tensile testing provides the most direct and controlled measurement of Young's Modulus.
Planar Biaxial Tensile Testing (Current Gold Standard Protocol)
Objective: To characterize the anisotropic, non-linear elastic properties of aortic tissue by applying controlled loads in two orthogonal directions (circumferential and axial).
Detailed Protocol:
- Tissue Harvest & Preparation: Harvest a segment of aorta (e.g., thoracic) immediately post-mortem. Rinse in cold physiologic saline solution (PSS). Carefully dissect away perivascular adipose and connective tissue. Cut into a ~10mm x ~10mm square specimen, marking the circumferential and axial orientations.
- Mounting: Secure the specimen in a biaxial testing system using four rakes (or suture lines) along each edge, ensuring even load distribution.
- Preconditioning: Subject the tissue to 10-15 cycles of equibiaxial stretch (e.g., up to 1.2 N force) to achieve a repeatable mechanical response.
- Testing Protocol: Perform a series of displacement-controlled tests:
- Equibiaxial: Stretch both axes simultaneously at a constant rate to a target maximum strain (e.g., 60% of estimated failure strain).
- Uniaxial (for anisotropy): Stretch one axis while maintaining a constant low force (e.g., 0.05 N) on the perpendicular axis, and vice versa.
- Data Acquisition: Simultaneously record applied forces (load cells) and displacements (video extensometry or markers) in both axes at a high sampling rate (≥100 Hz).
- Stress-Strain Calculation: Calculate Green-Lagrange strain and Second Piola-Kirchhoff stress from force and displacement data, using specimen thickness and initial dimensions.
- Young's Modulus Derivation: Fit the stress-strain data in the quasi-linear region (typically 10-40% strain) with a linear model. The slope of this fit is the incremental Young's Modulus (E) for each axis.
Pressure-Myography (Small Artery/Resistance Vessel Protocol)
Objective: To measure the functional stiffness of smaller, intact pressurized arterial segments.
Detailed Protocol:
- Vessel Cannulation: Mount a clean, undamaged arterial segment (~2mm long) on two glass microcannulas in a pressure myograph chamber filled with oxygenated PSS (37°C).
- Pressurization: Incrementally increase intraluminal pressure (e.g., in 20 mmHg steps from 0 to 140 mmHg) using a pressure servo system. Allow equilibration at each step.
- Imaging: Use a calibrated video camera to record the external diameter of the vessel at each pressure step.
- Data Analysis: Calculate internal radius ((r_i)) assuming incompressibility and measured wall thickness. Plot pressure vs. radius. The slope of the stress-strain curve derived from this data provides a functional incremental elastic modulus.
Table 2: Key Quantitative Findings in Age-Related Aortic Stiffening (Representative Data)
| Study Model | Age (Young) | E (Young) | Age (Aged) | E (Aged) | % Increase in E | Primary Method | Key Associated Change |
|---|---|---|---|---|---|---|---|
| C57BL/6 Mouse (Thoracic Aorta) | 3 months | 0.45 ± 0.10 MPa | 24 months | 1.85 ± 0.30 MPa | ~311% | Planar Biaxial Testing | Increased collagen deposition, elastin fragmentation. |
| Wistar Rat (Abdominal Aorta) | 6 months | 0.80 ± 0.15 MPa | 24 months | 2.20 ± 0.40 MPa | ~175% | Uniaxial Tensile Test | Medial calcification, cross-linking. |
| Human (in vivo estimation, Carotid) | 25 years | ~0.40 MPa | 75 years | ~1.60 MPa | ~300% | Echo-Tracking + Tonometry | Increased PWV, elevated systolic BP. |
Molecular Pathways Linking Aging to Increased Young's Modulus
Aortic stiffening is an active process driven by molecular changes in vascular smooth muscle cells (VSMCs) and the extracellular matrix (ECM).
The Scientist's Toolkit: Research Reagent Solutions
Table 3: Essential Reagents & Materials for Aortic Stiffness Research
| Item/Category | Example Product/Technique | Primary Function in Research |
|---|---|---|
| Ex Vivo Testing Systems | Planar Biaxial Tester (e.g., BioTester, CellScale); Pressure Myograph (e.g., DMT, Living Systems) | Apply precise mechanical loads/forces to vascular specimens and measure dimensional changes. |
| Live Imaging & Analysis | Two-Photon Microscopy (TPM); Second Harmonic Generation (SHG) | Visualize and quantify ECM architecture (elastin, collagen) in intact vessels without staining. |
| Histology & Staining | Picrosirius Red (collagen); Verhoeff-Van Gieson (elastin); Alizarin Red (calcification) | Qualitatively and quantitatively assess ECM composition and pathologic features. |
| Molecular Assays | Hydroxyproline Assay (total collagen); Desmosine/Isodesmosine ELISA (elastin turnover); LOX Activity Assay | Quantify specific ECM components and cross-linking enzyme activity. |
| Primary Cells & Culture | Human Aortic Smooth Muscle Cells (HAoSMCs); Mouse Aortic Explants | Model cellular responses to mechanical strain or pharmacologic intervention in vitro. |
| Pharmacologic Modulators | β-Aminopropionitrile (BAPN, LOX inhibitor); Angiotensin II (pro-fibrotic stimulus); Senolytics (e.g., Dasatinib + Quercetin) | Probe molecular pathways involved in stiffening or test potential therapeutic agents. |
Within the context of investigating age-related increases in aortic stiffness—quantified as a rise in Young's modulus—understanding the structural interplay of aortic components is foundational. The aorta's unique elastic properties arise from a precisely organized extracellular matrix (ECM), primarily elastin and collagen, orchestrated by vascular smooth muscle cells (VSMCs). This whitepaper details the structural and functional roles of these components, serving as a technical guide for researchers dissecting the mechanisms underlying pathological vascular stiffening.
Core Structural Components and Their Mechanical Roles
Elastin: The Source of Reversible Distensibility
Elastin forms concentric lamellae in the medial layer, providing the long-range, low-energy elasticity critical for the Windkessel effect. Its hydrophobic, cross-linked polymer network stores entropic energy upon stretching.
Collagen: The Load-Bearing Reinforcement
Type I and III collagen fibrils, with a much higher intrinsic stiffness, are wavy in the unloaded state. They progressively recruit and bear load at higher pressures, preventing over-distension. The elastin-collagen ratio is a key determinant of the pressure-diameter curve.
Vascular Smooth Muscle Cells (VSMCs): Active Regulators and Architects
VSMCs synthesize, organize, and degrade the ECM. Through their contractile tone and dynamic adhesion via integrins and focal adhesions, they modulate the pre-stress (residual stress) within the vessel wall, directly influencing passive mechanical properties.
Table 1: Key Biomechanical and Biochemical Properties of Aortic Structural Components
| Component | Primary Function | Typical Young's Modulus (Approx.) | Key Structural Form | Dominant Role in Pressure Range |
|---|---|---|---|---|
| Elastin | Energy storage, reversible elasticity | 0.3 - 0.6 MPa | Concentric lamellae, cross-linked network | Low-to-physiological (Diastolic recoil) |
| Collagen | Tensile strength, limit distension | 1 - 2 GPa (fibril) | Wavy, cross-linked fibrils (Types I, III) | High-pressure (Systolic reinforcement) |
| VSMCs (Active) | Tone regulation, ECM homeostasis | Variable (Active stress: ~50-150 kPa) | Spindle-shaped, contractile filaments | Active modulation of wall stress |
| Composite Aorta (Ex Vivo) | Integrated Windkessel function | 0.5 - 5 MPa (Age-dependent) | Lamellar unit structure | Full cardiac cycle |
Methodologies for Investigating Aortic Biomechanics and Biology
Biaxial Tensile Testing for Passive Mechanical Properties
Protocol: A rectangular specimen from the thoracic aorta is mounted on a biaxial testing system with suture loops or rakes. The sample is submerged in physiological saline at 37°C.
- Preconditioning: Subject to 10-15 cycles of equibiaxial stretch to a physiological load.
- Stress-Relaxation Test: Stretch to a set strain and hold; record force decay over time (viscoelasticity).
- Primary Protocol: Perform a series of stretch protocols (equibiaxial, strip biaxial). Record forces in circumferential and axial directions.
- Data Analysis: Calculate Green strain and Cauchy stress. Fit data to a constitutive model (e.g., Holzapfel-Gasser-Ogden) to derive material parameters, including the directional Young's modulus at specified stress levels.
Pressure Myography for Vasoactive and Passive Assessment
Protocol: A segment of murine or rodent aorta (~2mm) is cannulated on glass micropipettes in a pressure myograph chamber.
- Passive Diameter-Pressure Curve: In Ca²⁺-free PBS, pressure is increased stepwise (e.g., 0-180 mmHg). Outer diameter is tracked via video microscopy.
- Compliance/Stiffness Calculation: Incremental elastic modulus (Einc) is calculated at each pressure step using Laplace's law.
- Active Contraction Assay: In physiological solution, pre-contract with phenylephrine (1 µM), then generate a concentration-response curve to an agonist (e.g., acetylcholine for endothelial function).
Quantification of ECM Composition
Protocol:
- Tissue Hydrolysis: Aortic tissue is dried, weighed, and hydrolyzed in 6N HCl at 110°C for 24h.
- Hydroxyproline Assay for Collagen: Hydrolysate is reacted with chloramine-T and dimethylaminobenzaldehyde. Absorbance at 560nm is compared to hydroxyproline standards.
- Desmosine/Isodesmosine Assay for Elastin: Hydrolysate is analyzed via ELISA or LC-MS/MS using specific antibodies against these cross-links unique to mature elastin.
- Expression: Reported as µg/mg dry tissue weight or collagen/elastin ratio.
Visualizing Key Relationships and Pathways
Diagram 1: Pathways Driving Age-Related Aortic Stiffening (97 chars)
Diagram 2: Integrated Experimental Workflow for Aortic Stiffness Research (99 chars)
The Scientist's Toolkit: Key Research Reagent Solutions
Table 2: Essential Reagents and Materials for Aortic Elasticity Research
| Category | Item/Solution | Key Function & Rationale |
|---|---|---|
| Biomechanics | Physiological Salt Solution (PSS) | Maintains ionic balance and tissue viability during ex vivo testing. Often requires bubbling with 95% O₂/5% CO₂. |
| Ca²⁺-Free PSS with EGTA | Chelates calcium to fully relax VSMC tone, allowing assessment of passive wall properties. | |
| Holzapfel-Gasser-Ogden Model Software | Standard constitutive model for fitting anisotropic, nonlinear arterial tissue data. | |
| Histology & Imaging | Verhoeff-Van Gieson (VVG) Stain | Differentiates elastin (black) from collagen (red/pink) for qualitative lamellar structure analysis. |
| Picrosirius Red Stain | Collagen-specific stain; under polarized light, quantifies collagen type and alignment. | |
| Anti-α-SMA Antibody | Gold-standard marker for contractile VSMCs via immunofluorescence/histochemistry. | |
| Biochemical Assays | Hydroxyproline Assay Kit | Colorimetric quantification of total collagen content in tissue hydrolysates. |
| Desmosine ELISA Kit | Specific quantification of mature, cross-linked elastin. | |
| Cell & Molecular | TGF-β1 Recombinant Protein | Key cytokine to stimulate pro-fibrotic (collagen-producing) VSMC phenotype in vitro. |
| MMP-2/9 Activity Assay Kit | Fluorometric or zymographic assessment of gelatinase activity in tissue lysates or conditioned media. | |
| LOX Inhibitor (BAPN) | β-Aminopropionitrile blocks lysyl oxidase, inhibiting collagen/elastin cross-linking for mechanistic studies. | |
| Animal Models | Angiotensin II Infusion Model | Induces hypertension, ECM remodeling, and aortic stiffening in rodents over weeks. |
| Apolipoprotein E-deficient (ApoE⁻/⁻) Mice | Model of atherosclerosis, often used in conjunction with aging to study combined pathology. |
Key Age-Related Histological and Biochemical Changes in the Aortic Wall
This whitepaper details the histological and biochemical alterations in the aortic wall associated with aging, framed within a broader thesis investigating changes in aortic Young's modulus. Understanding these structural and compositional shifts is critical for research into vascular stiffening and the development of therapeutic interventions.
The aorta undergoes a continuum of changes from maturation to senescence, characterized by progressive remodeling of its three-layered architecture—the intima, media, and adventitia. These changes directly contribute to the age-related increase in aortic stiffness, quantified by Young's modulus, and elevate cardiovascular risk. This guide provides an in-depth technical analysis of these alterations.
Histological Changes
Aging induces distinct morphological alterations across the aortic wall layers, as summarized below.
Table 1: Key Age-Related Histological Changes in the Aortic Wall
| Aortic Layer | Primary Age-Related Change | Quantitative Trend | Functional Consequence |
|---|---|---|---|
| Intima | Thickening & Endothelial Dysfunction | Thickness increases ~2-3 fold from age 20 to 80. | Impaired vasodilation, increased permeability, pro-inflammatory state. |
| Media | Elastin Fragmentation & Calcification | Elastin content decreases by ~30-50%; calcium deposition increases exponentially after age 50. | Reduced elasticity, increased stiffness, predisposition to dilation. |
| Smooth Muscle Cell (SMC) Phenotype Shift | Increased synthetic/apoptotic SMCs; decreased contractile SMCs. | Loss of contractility, increased ECM secretion. | |
| Adventitia | Collagen Deposition & Cross-Linking | Collagen content increases 1.5-2 fold; advanced glycation end-product (AGE) cross-links accumulate. | Increased wall fibrosis and tensile strength, reduced compliance. |
Experimental Protocol: Histomorphometric Analysis
Aim: To quantify intima-media thickness (IMT), elastin fragmentation, and collagen density in aortic tissue sections. Methodology:
- Tissue Procurement & Sectioning: Obtain human or animal aortic segments. Fix in 4% paraformaldehyde, dehydrate, and embed in paraffin. Section at 5-7 µm thickness.
- Staining:
- Verhoeff-Van Gieson (VVG): Stains elastin fibers black, collagen red, and cell nuclei blue/black.
- Masson's Trichrome: Stains collagen blue, nuclei dark red/purple, and cytoplasm/ muscle fibers red.
- Alizarin Red S: For detection of calcium deposits.
- Image Acquisition & Analysis: Capture high-resolution images using a light microscope. Use image analysis software (e.g., ImageJ, QuPath):
- IMT: Measure perpendicular distance from lumen to media-adventitia border at multiple points.
- Elastin Fragmentation Index: Calculate (number of breaks in elastin lamellae) / (total length of lamellae).
- Collagen/Elastin Area Fraction: Apply color deconvolution and thresholding to determine the percentage area of stained collagen or elastin per field.
Title: Workflow for Aortic Histomorphometric Analysis
Biochemical and Molecular Changes
The histological changes are driven by underlying biochemical dysregulation.
Table 2: Key Age-Related Biochemical Changes in the Aortic Wall
| Process | Key Mediators/Molecules | Quantitative/Qualitative Change | Impact on Aortic Wall |
|---|---|---|---|
| ECM Degradation | MMP-2, MMP-9, Cathepsins | Activity increases 2-4 fold with age. | Elastin and collagen breakdown, lamellar fragmentation. |
| ECM Deposition & Cross-linking | Collagen I & III, Lysyl Oxidase (LOX), AGEs | Collagen synthesis ↑; AGE cross-links accumulate linearly with age. | Increased fibrosis and non-enzymatic stiffening. |
| Calcification | Osteogenic markers (BMP-2, Runx2), Calcium Phosphate | Vascular smooth muscle cell (VSMC) osteogenic transition; medial microcalcifications. | Focal stiffening, stress concentrators. |
| Oxidative Stress & Inflammation | ROS (e.g., H2O2, ONOO-), NF-κB, TNF-α, IL-6 | ROS production ↑ >50%; inflammatory cytokines elevated. | Endothelial dysfunction, SMC senescence, MMP activation. |
| Cellular Senescence | p53, p21, p16INK4a, SA-β-Gal | Prevalence of senescent VSMCs increases dramatically after middle age. | Secretory phenotype promotes inflammation and remodeling. |
Signaling Pathways in Age-Related Aortic Remodeling
Title: Key Signaling Pathways in Aortic Aging
Experimental Protocol: Western Blot Analysis of Aortic ECM Proteins
Aim: To semi-quantify protein levels (e.g., collagen I, elastin, MMP-2) in aortic lysates. Methodology:
- Tissue Homogenization: Pulverize frozen aortic tissue under liquid N2. Homogenize in RIPA buffer with protease/phosphatase inhibitors on ice. Centrifuge at 14,000g for 15 min at 4°C. Collect supernatant.
- Protein Quantification: Perform BCA assay.
- Gel Electrophoresis: Load 20-40 µg protein per lane on a 4-20% gradient SDS-PAGE gel. Run at constant voltage.
- Transfer: Transfer proteins to PVDF membrane using wet or semi-dry transfer.
- Immunoblotting: Block membrane with 5% non-fat milk. Incubate with primary antibody (e.g., anti-collagen I, 1:1000) overnight at 4°C. Wash and incubate with HRP-conjugated secondary antibody (1:5000) for 1 hour at RT.
- Detection & Analysis: Develop using enhanced chemiluminescence (ECL) substrate. Capture chemiluminescent signal digitally. Normalize target protein band density to a loading control (e.g., GAPDH).
The Scientist's Toolkit: Key Research Reagents
Table 3: Essential Research Reagents for Studying Aortic Aging
| Reagent/Material | Supplier Examples | Primary Function in Research |
|---|---|---|
| Pressure Myograph System | DMT, Living Systems | Ex vivo measurement of vessel diameter under controlled pressure, allowing direct calculation of Young's modulus and compliance. |
| Polyclonal/Monoclonal Antibodies (e.g., Anti-Elastin, Anti-MMP-9, Anti-p21) | Abcam, Cell Signaling, Sigma-Aldrich | Target protein detection and quantification via immunohistochemistry, Western blot, or ELISA. |
| MMP Activity Assay Kits (Fluorogenic) | R&D Systems, Abcam | Quantitative measurement of specific MMP enzymatic activity in tissue homogenates or conditioned media. |
| Advanced Glycation Endproduct (AGE) ELISA Kits | Cell Biolabs, Cusabio | Specific quantification of AGE levels (e.g., pentosidine, CML) in aortic tissue lysates or serum. |
| Senescence-Associated β-Galactosidase (SA-β-gal) Staining Kit | Cell Signaling Technology | Histochemical detection of senescent cells in aortic tissue sections or cultured VSMCs. |
| Recombinant Proteins (e.g., TGF-β1, TNF-α) | PeproTech, R&D Systems | Used to stimulate specific age-related pathways (fibrosis, inflammation) in in vitro cell culture models. |
| Elastin-Specific Dyes (e.g., Fastin Elastin Assay) | Biocolor | Colorimetric quantification of soluble elastin fragments in biological samples. |
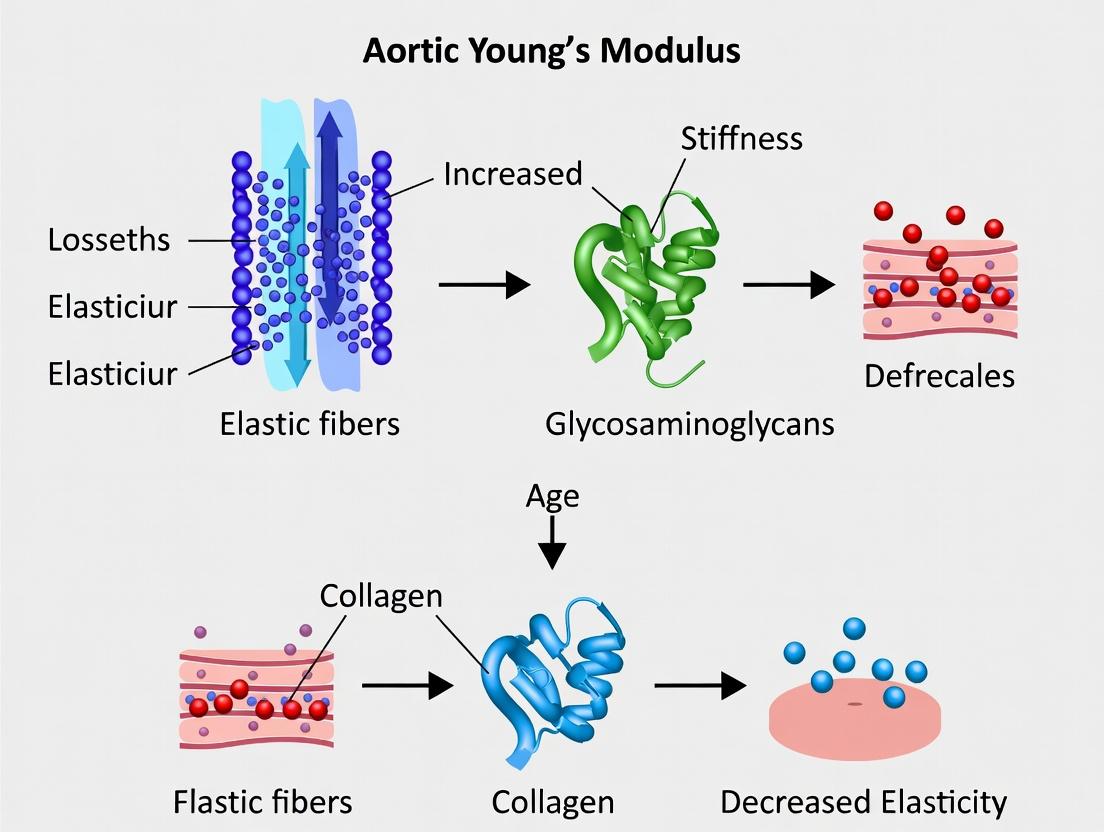
The aging aortic wall is characterized by a predictable sequence of histological and biochemical events: elastolysis, collagenous fibrosis, calcification, and chronic inflammation. These interdependent processes fundamentally alter the vessel's biomechanical properties, leading to a measurable increase in Young's modulus. This guide provides a foundational framework and technical methodologies for researchers aiming to elucidate mechanisms and identify therapeutic targets to mitigate aortic stiffening.
This technical whitepaper, framed within a broader thesis on age-related changes in aortic Young's modulus, explores the paradoxical link between extracellular matrix (ECM) degradation and the macroscopic stiffening of vascular tissue. We synthesize current research to detail the molecular and cellular mechanisms—primarily driven by age-associated changes in collagen, elastin, and crosslinking—that translate to measurable increases in aortic stiffness, a key biomarker of cardiovascular aging and a target for therapeutic intervention.
Aortic stiffening, quantified by an increase in the Young's modulus, is a hallmark of vascular aging and a strong independent predictor of adverse cardiovascular events. While the macroscopic material property is "stiffness," the underlying histological narrative is not simply one of accumulation but of dysregulated turnover. The core paradox lies in the observation that fragmentation and degradation of key structural proteins, particularly elastin, coincide with a net increase in tissue stiffness. This whitpaper delineates the mechanistic pathway from enzymatic activity at the molecular scale to altered macromechanical function.
Core Molecular Mechanisms
Elastin Degradation and Fragmentation
With advancing age, the highly stable, lifelong protein elastin undergoes progressive proteolytic fragmentation.
- Key Enzymes: Matrix Metalloproteinases (MMPs -2, -9, -12) and Cathepsins (S, K) are upregulated in response to oxidative stress and inflammatory cytokines (TGF-β, IL-6).
- Consequence: The continuous, load-bearing elastic lamellae in the medial layer of the aorta develop microfractures. This disrupts the innate elasticity of the vessel, shifting mechanical load to stiffer components.
Collagen Dysregulation
As elastin's function fails, collagen—a much stiffer protein—becomes the dominant load-bearing element.
- Increased Deposition: TGF-β signaling promotes collagen I and III synthesis by vascular smooth muscle cells (VSMCs) and fibroblasts.
- Altered Crosslinking: Age-related non-enzymatic crosslinks (advanced glycation end-products, AGEs) form between collagen fibers via the Maillard reaction. These crosslinks, distinct from physiological enzymatic crosslinks (mediated by lysyl oxidase, LOX), create excessive, irreversible linkages that drastically reduce fiber slippage and tissue compliance.
Glycocalyx and Ground Substance Changes
The proteoglycan-rich ground substance, which facilitates intermolecular sliding, diminishes with age, further contributing to a less lubricated, more rigid ECM environment.
Table 1: Molecular and Biomechanical Changes in the Aging Aorta
| Parameter | Young/Healthy State | Aged/Stiff State | Measurement Technique | Key References (Recent) |
|---|---|---|---|---|
| Aortic Pulse Wave Velocity (PWV) | ~5-7 m/s (Human) | ~10-15 m/s (Human) | Non-invasive tonometry (gold standard) | Mitchell et al., Circulation, 2021 |
| Aortic Young's Modulus | ~0.4 - 0.8 MPa (Murine Ascending) | ~1.2 - 2.5 MPa (Murine Ascending) | Biaxial tensile testing, Atomic Force Microscopy (AFM) | Ferruzzi et al., Biomech Model Mechanobiol, 2022 |
| Elastin Content | High, intact lamellae | Reduced by 30-50%, fragmented | Histology (Verhoeff-Van Gieson), Desmosine assay | Wagensell & Mecham, Compr Physiol, 2021 |
| Collagen Content (Total) | Lower relative abundance | Increased 2-3 fold | Hydroxyproline assay, picrosirius red staining | Tsamis et al., J Biomech, 2022 |
| AGE Crosslink Density | Low | Highly Elevated (e.g., Pentosidine) | HPLC, mass spectrometry, autofluorescence | Semba et al., J Gerontol A Biol Sci, 2021 |
| MMP-2/9 Activity | Basal, homeostatic | Significantly upregulated | Zymography, FRET-based probes | Wang et al., Aging Cell, 2023 |
Detailed Experimental Protocols
Protocol: Ex Vivo Biaxial Mechanical Testing of Murine Aorta
Objective: To measure the anisotropic stress-strain relationship and calculate the incremental Young's modulus.
- Tissue Harvest: Euthanize mouse, excise descending thoracic aorta, place in chilled PBS.
- Specimen Preparation: Clean adventitial fat under dissecting microscope. Cut into ~3mm ring. Measure unloaded dimensions (diameter, length) via calibrated microscopy.
- Mounting: Mount specimen on opposing pairs of hooks connected to a force transducer (axial) and a pressure servo-control system (circumferential) in a organ bath filled with physiological saline at 37°C.
- Preconditioning: Apply 10 cycles of pressurization (0-140 mmHg) at a fixed axial stretch ratio to achieve a repeatable mechanical state.
- Equibiaxial Protocol: Perform pressure-diameter tests at multiple fixed axial stretches, and axial force-length tests at multiple fixed pressures.
- Data Analysis: Use Cauchy stress and Green strain to plot stress-strain curves. The incremental Young's modulus is calculated as the slope of the stress-strain curve in the high-strain region (80-100 mmHg equivalent).
Protocol: In Situ Zymography for Localized MMP Activity
Objective: To visualize and localize gelatinolytic (MMP-2/9) activity in aortic tissue sections.
- Sectioning: Flash-freeze unfixed aortic tissue in OCT. Cryosection at 8-10 µm thickness.
- Substrate Application: Apply reaction mixture containing DQ-gelatin (heavily labeled with FITC, fluorescence quenched) diluted in zymography developing buffer. Use a negative control section with buffer containing 10mM EDTA (MMP inhibitor).
- Incubation: Incubate slides in a dark, humidified chamber at 37°C for 24-48 hours.
- Visualization: Rinse slides, mount with DAPI-containing medium. Image using a fluorescence microscope (FITC channel). Proteolytic cleavage of DQ-gelatin releases brightly fluorescent peptides, indicating sites of active MMP-2/9.
Signaling Pathway and Mechanistic Diagram
Diagram Title: Molecular to Macromechanical Pathway in Aortic Stiffening
The Scientist's Toolkit: Key Research Reagent Solutions
Table 2: Essential Reagents and Materials for Investigating ECM-Mediated Stiffening
| Item | Function & Application | Example Vendor/Cat. # (Illustrative) |
|---|---|---|
| DQ-Gelatin, Fluorescein Conjugate | Fluorescence-quenched substrate for in situ zymography to localize and quantify MMP-2/9 activity in tissue sections. | Thermo Fisher Scientific, D12054 |
| Human Aortic Smooth Muscle Cells (HASMCs) | Primary cell model for studying VSMC-ECM interactions, collagen synthesis, and responses to stiffness (on tunable hydrogels). | Lonza, CC-2571 |
| Polyacrylamide Hydrogels with Tunable Stiffness | 2D cell culture substrates to mimic physiological (soft) and pathological (stiff) mechanical environments for mechanotransduction studies. | Matrigen, Softwell plates |
| β-Aminopropionitrile (BAPN) | Irreversible inhibitor of lysyl oxidase (LOX) activity. Used to probe the role of enzymatic collagen crosslinking. | Sigma-Aldrich, A3134 |
| ALT-711 (Alagebrium) | Breaker of advanced glycation end-product (AGE) crosslinks. Key experimental therapeutic to reverse AGE-mediated stiffening. | Cayman Chemical, 14673 |
| MMP-2/9 Inhibitor I | Selective, reversible inhibitor of MMP-2 and MMP-9 gelatinases. Used to confirm the mechanistic role of specific MMPs. | MilliporeSigma, 444250 |
| Anti-Desmosine Antibody | For ELISA or immunohistochemistry to specifically quantify elastin degradation products, a biomarker of elastolysis. | Antibodies-Online, ABIN961530 |
| Picrosirius Red Stain Kit | Histological stain for collagen (types I and III). Under polarized light, quantifies collagen alignment and density. | Polysciences, Inc., 24901 |
This whitepaper examines the pivotal role of aortic stiffness as an independent predictor of cardiovascular disease (CVD) risk. It is framed within a broader thesis investigating age-related changes in the aortic Young's modulus—the intrinsic biomechanical property quantifying arterial wall stiffness. The central thesis posits that age-associated biochemical and structural alterations in the aortic extracellular matrix (ECM) lead to a measurable increase in the Young's modulus, which precedes and predicts clinical CVD events. This document synthesizes current epidemiological evidence, clinical correlates, and experimental methodologies for quantifying aortic stiffness and its implications for drug development.
The following tables consolidate key quantitative findings from recent meta-analyses and prospective cohort studies on aortic stiffness, measured primarily via carotid-femoral pulse wave velocity (cfPWV), and its association with hard CVD endpoints.
Table 1: Predictive Value of Aortic Stiffness (cfPWV) for CVD Outcomes
| Endpoint | Hazard Ratio (HR) per 1 m/s increase | Population (Study) | 95% Confidence Interval |
|---|---|---|---|
| Total CVD Events | 1.14 | General Population (Vlachopoulos et al., Meta-Analysis) | 1.12–1.16 |
| Cardiovascular Mortality | 1.15 | Hypertensive Patients (Sheng et al., Meta-Analysis) | 1.09–1.21 |
| Fatal & Nonfatal Stroke | 1.17 | General/Elderly (Ben-Shlomo et al., Individual Participant Meta-Analysis) | 1.11–1.22 |
| Coronary Heart Disease | 1.12 | General/Elderly (Ben-Shlomo et al., Individual Participant Meta-Analysis) | 1.06–1.18 |
| Heart Failure | 1.19 | ARIC Study (Atherosclerosis Risk in Communities) | 1.10–1.30 |
Table 2: Clinical Correlates and Associated Changes in Aortic Stiffness
| Clinical Condition / Factor | Approx. cfPWV Increase vs. Healthy Control | Primary Pathophysiological Link to Young's Modulus |
|---|---|---|
| Essential Hypertension | +1.5 to +3.0 m/s | Increased wall stress, smooth muscle cell hypertrophy, ECM remodeling. |
| Type 2 Diabetes | +1.8 to +3.5 m/s | Advanced glycation end-product (AGE) cross-linking of collagen/elastin. |
| Chronic Kidney Disease (Stage 3-4) | +2.5 to +4.0 m/s | Medial calcification, secondary hyperparathyroidism, AGE accumulation. |
| Aging (Per decade >50) | +0.7 to +1.2 m/s per decade | Fragmentation of elastin fibers, increased collagen deposition & cross-linking. |
| Obesity (Metabolic Syndrome) | +1.0 to +2.0 m/s | Low-grade inflammation, endothelial dysfunction, increased aortic wall stress. |
Experimental Protocols for Key Assessments
Protocol 3.1: In Vivo Measurement of Carotid-Femoral Pulse Wave Velocity (cfPWV)
- Objective: Non-invasive gold-standard assessment of regional aortic stiffness.
- Equipment: Tonometer probes (e.g., SphygmoCor, Complior), ECG monitor, tape measure.
- Procedure:
- The participant rests in the supine position for 10 minutes in a controlled-temperature room.
- Electrodes are placed for simultaneous ECG recording (R-wave as timing reference).
- Two recording sites are identified: the common carotid artery and the common femoral artery.
- The surface distance between the two sites is measured (D). A subtraction method (sternal notch-to-carotid distance subtracted from sternal notch-to-femoral distance) is recommended to approximate the aortic path length.
- Sequential (or simultaneous) high-fidelity pressure waveforms are recorded at each site for ≥10 consecutive beats.
- The foot of each waveform (intersection of the tangent of the systolic upstroke with the diastolic decay line) is identified.
- The time delay (Δt) between the feet of the carotid and femoral waveforms is calculated.
- Calculation: cfPWV (m/s) = D (meters) / Δt (seconds).
Protocol 3.2: Ex Vivo Biaxial Tensile Testing for Aortic Young's Modulus
- Objective: Direct mechanical characterization of aortic wall material properties.
- Equipment: Biaxial tensile testing machine, environmental bath, optical markers, video extensometer.
- Tissue Preparation: Aortic rings (e.g., thoracic aorta) are cleaned of perivascular tissue and cut into rectangular specimens. A precise 2D grid is marked on the intimal surface.
- Procedure:
- The specimen is mounted in the biaxial tester, with each edge clamped to independent actuators in the circumferential and axial directions.
- The bath is filled with physiologic saline solution at 37°C.
- A series of equibiaxial and non-equibiaxial stretch protocols are performed under force or displacement control.
- The deformation of the optical grid is tracked. Engineering stress (σ) is calculated as applied force divided by initial cross-sectional area. Strain (ε) is calculated from marker displacement.
- Stress-strain curves are generated for both principal directions.
- Calculation: The incremental Young's Modulus (E) is derived from the linear slope of the stress-strain curve in the high-strain (physiological) region, where collagen fibers are fully engaged (typically >30-40% strain).
Protocol 3.3: Histomorphometric Analysis of Aortic ECM
- Objective: Quantify structural changes underlying increased Young's modulus.
- Equipment: Light/fluorescence microscope, image analysis software (e.g., ImageJ).
- Staining Protocols:
- Van Gieson's or Verhoeff-Van Gieson: Elastin appears black, collagen red/pink.
- Picrosirius Red: Collagen types I (orange/red) and III (green) under polarized light.
- Procedure:
- Fixed, paraffin-embedded aortic sections are stained.
- Multiple high-power fields per sample are imaged systematically.
- Quantification Metrics:
- Elastin Fragmentation: Number of breaks per unit length of elastin lamella.
- Collagen-to-Elastin Area Ratio: Color thresholding is used to calculate the proportional area of stained collagen vs. elastin.
- Medial Thickness: Measured from internal to external elastic lamina.
Visualization of Pathways and Workflows
Title: Aortic Stiffening Pathogenesis & CVD Risk Pathway
Title: Experimental Workflow: From Mechanics to Epidemiology
The Scientist's Toolkit: Key Research Reagent Solutions
Table 3: Essential Materials for Aortic Stiffness Research
| Category / Item | Example Product/Specification | Primary Function in Research |
|---|---|---|
| In Vivo Assessment | ||
| Arterial Tonometry System | SphygmoCor XCEL, Complior Analyse | Records high-fidelity arterial waveforms for cfPWV calculation. |
| Ex Vivo Mechanical Testing | ||
| Biaxial/Tensile Test System | Instron BioPuls, CellScale BioTester | Applies controlled multiaxial loads to aortic specimens to derive stress-strain curves. |
| Physiological Bath Solution | Krebs-Ringer Bicarbonate Buffer | Maintains tissue viability and ionic balance during mechanical testing. |
| Histology & Microscopy | ||
| Elastin-Specific Stain | Verhoeff-Van Gieson Stain Kit | Differentiates elastin (black) from collagen (red) for fragmentation analysis. |
| Collagen-Specific Stain | Picrosirius Red Stain Kit | Enhances birefringence of collagen fibers under polarized light for typing and quantification. |
| Molecular Analysis | ||
| AGE Detection Antibody | Anti-Advanced Glycation End Product (CML, Pentosidine) | Immunohistochemical localization and quantification of AGE deposition in vessel wall. |
| MMP Activity Assay | Fluorescent/Tryptic Peptide Substrate (e.g., for MMP-2, -9) | Quantifies enzymatic activity of matrix metalloproteinases in tissue homogenates. |
| Animal Models | ||
| AGE-infused Rodent Model | Repeated injections of glycolaldehyde or ribose. | Induces rapid aortic stiffening via non-enzymatic collagen cross-linking, mimicking diabetic aging. |
| Data Analysis | ||
| Image Analysis Software | ImageJ (FIJI) with custom macros | Performs automated quantitation of elastin breaks, collagen area, and wall dimensions. |
| Statistical Software | R, SPSS, SAS | Executes survival analysis (Cox regression) correlating cfPWV with CVD events. |
Measuring the Inevitable: In Vivo and Ex Vivo Techniques for Assessing Age-Related Aortic Stiffening
Within the broader thesis investigating age-related changes in aortic Young's modulus, selecting the appropriate ex vivo mechanical testing methodology is paramount. The aorta, a complex composite structure, exhibits nonlinear, anisotropic, and viscoelastic behavior. Accurately quantifying its stiffness—often represented by the Young's modulus—requires methods that can simulate physiological loading conditions. This guide details the two gold standard ex vivo approaches: uniaxial/tensile testing and biaxial inflation testing, providing researchers with the technical foundation to study arterial stiffening in aging and evaluate potential therapeutic interventions.
Core Methodologies: Principles and Applications
Uniaxial/Tensile Testing
Principle: A rectangular strip or ring of aortic tissue is stretched along a single axis (typically longitudinal or circumferential) while measuring the applied force and resulting displacement. This method is ideal for isolating the material properties in a specific direction. Primary Application: Efficiently determining the directional Young's modulus (circumferential vs. longitudinal) and ultimate tensile strength. It is widely used for comparative studies of tissue integrity and stiffness across age groups or treatment conditions.
Biaxial Inflation Testing
Principle: A segment of the aorta is pressurized internally (often using saline) while held at its in vivo length. This protocol simultaneously applies circumferential and longitudinal stresses, more closely mimicking the multiaxial stress state in vivo. Primary Application: Characterizing the full anisotropic constitutive behavior of the arterial wall. It is critical for developing accurate material models that capture the complex, nonlinear stiffening with age under physiologically relevant loads.
Detailed Experimental Protocols
Protocol for Uniaxial Tensile Testing of Murine Aorta
This protocol is optimized for high-throughput screening of age-related stiffness changes.
1. Tissue Harvest & Preparation:
- Euthanize subject following approved IACUC protocol.
- Rapidly expose and excise the thoracic aorta (e.g., from aortic arch to diaphragm).
- Place tissue in chilled, oxygenated physiological saline solution (PSS).
- Under a dissection microscope, carefully remove perivascular adipose and connective tissue.
- Cut the vessel open longitudinally to create a flat sheet.
- Cut rectangular strips (e.g., 2-3 mm width) in circumferential and longitudinal orientations using a precision blade and template.
2. Mounting & Pre-conditioning:
- Mount each strip in a tensile testing system (e.g., Instron, Bose) using suture lines or specialized soft tissue grips.
- Set gauge length (distance between grips) precisely using a caliper.
- Immerse specimen bath in 37°C PSS.
- Apply 10-15 cycles of a low-strain load (e.g., 0-5% strain) to precondition the tissue and achieve a repeatable mechanical response.
3. Testing & Data Acquisition:
- Perform a monotonic tensile test to failure at a constant strain rate (e.g., 0.1 mm/s) or conduct a series of loading-unloading cycles to increasing strains.
- Simultaneously record force (N) and displacement (mm) at a high sampling rate (>100 Hz).
- Calculate engineering stress (Force / initial cross-sectional area) and engineering strain ((Current length - Initial length) / Initial length).
Protocol for Biaxial Inflation Testing of Aortic Segments
This protocol provides a more comprehensive mechanical profile.
1. Specimen Preparation & Cannulation:
- Harvest a segment of aorta (e.g., 5-10 mm in length).
- Cannulate both ends of the segment onto specially designed glass or stainless-steel cannulas.
- Secure the vessel with suture or fine ligature.
- Mount the cannulated specimen in a temperature-controlled bath filled with PSS at 37°C.
2. System Calibration & Pressurization:
- Connect one cannula to a computer-controlled pressure servo-pump and the other to a pressure transducer.
- Connect the bath to a separate length-control actuator.
- Gently pressurize to 5 mmHg to check for leaks and ensure the vessel is unbuckled.
- Adjust the axial actuator to set the vessel to its in vivo length (L₀), determined via marker dots or from anatomical landmarks.
3. Multiaxial Loading Protocol:
- Apply simultaneous internal pressure and axial stretch according to a predefined protocol. A common protocol is:
- Hold axial stretch constant at multiple levels (e.g., 1.0, 1.1, 1.2 times L₀).
- At each fixed stretch, ramp pressure from 0 to 140 mmHg (or physiological max) in cycles.
- Use video extensometry or diameter tracking lasers to measure outer diameter changes in real-time.
- Record synchronized data: Pressure (mmHg), outer diameter (mm), axial force (N), and actuator position (mm).
Data Analysis & Young's Modulus Calculation
Data from both methods are used to construct stress-strain curves. The Young's modulus (E) is the slope of the linear portion of this curve in the high-strain region (often >30% strain for soft tissues), representing the "stiffness" of the loaded collagen fibers.
- From Uniaxial Data: ( E = \Delta \text{Stress} / \Delta \text{Strain} ) in the linear region. Circumferential and longitudinal moduli are calculated separately from strips cut in each orientation.
- From Biaxial Data: Constitutive modeling (e.g., using a Fung-elastic model) is typically employed. An Incremental Modulus at a specific pressure (e.g., 100 mmHg) can be calculated from the local slope of the circumferential stress-strain curve derived from pressure-diameter data.
Table 1: Representative Quantitative Data from Aging Aorta Studies
Data synthesized from recent literature on murine models (e.g., C57BL/6).
| Age Group | Testing Method | Direction | Young's Modulus (kPa) | Notes / Condition |
|---|---|---|---|---|
| Young (3-6 mo) | Uniaxial Tensile | Circumferential | 850 - 1200 | Linear region, ~40-60% strain |
| Aged (24-28 mo) | Uniaxial Tensile | Circumferential | 1800 - 2800 | Marked increase vs. young |
| Young (3-6 mo) | Uniaxial Tensile | Longitudinal | 600 - 900 | Typically lower than circumferential |
| Aged (24-28 mo) | Uniaxial Tensile | Longitudinal | 1100 - 1600 | |
| Young (3-6 mo) | Biaxial Inflation | Circumferential @ 100 mmHg | 700 - 1000 | Incremental modulus at physiologic load |
| Aged (24-28 mo) | Biaxial Inflation | Circumferential @ 100 mmHg | 1500 - 2300 | Significant age-related stiffening |
Table 2: The Scientist's Toolkit: Essential Research Reagents & Materials
| Item | Function & Rationale |
|---|---|
| Physiological Saline Solution (PSS) | Oxygenated buffer (e.g., Krebs) to maintain tissue viability and prevent degradation during testing. |
| Protease/Enzyme Inhibitors | Cocktail (e.g., EDTA, AEBSF) added to PSS to inhibit post-explant metalloproteinase (MMP) activity that degrades ECM. |
| Suture (e.g., 9-0 Nylon) | For cannulating vessels in biaxial tests or securing tissue strips in tensile grips with minimal stress concentration. |
| Passive Diameter Tracking Markers | Micro-dots applied to the adventitia for optical strain measurement in biaxial systems. |
| Collagen/Elastin Stains | (e.g., Picrosirius Red, Verhoeff-Van Gieson) for post-test histological correlation of mechanics with ECM structure. |
| Calcium Chelators (EGTA) | Used in some protocols to assess the contribution of vascular smooth muscle cell tone to measured stiffness. |
| Biaxial Test System | Computer-controlled system with pressure servo, axial actuator, force transducer, and video extensometer. |
| Tensile Testing Machine | High-resolution load frame (e.g., 5-50N load cell) with temperature-controlled tissue bath. |
Workflow and Pathophysiological Context
Experimental Workflow for Aortic Stiffness Testing
Age-Related ECM Changes Driving Stiffness
Uniaxial tensile and biaxial inflation protocols serve complementary roles in the ex vivo assessment of aortic Young's modulus. Uniaxial testing offers a streamlined, directional analysis suitable for high-throughput comparative studies, while biaxial testing provides a physiologically superior, multiaxial characterization essential for constitutive modeling. Within a thesis on age-related aortic stiffening, the judicious application of these gold-standard methods allows for the precise quantification of mechanical property changes, enabling robust correlation with underlying extracellular matrix alterations and providing a critical platform for evaluating novel pharmacotherapies aimed at mitigating vascular aging.
Pulse Wave Velocity (PWV) is the gold-standard non-invasive technique for assessing arterial stiffness in vivo. Within the context of age-related aortic degeneration research, PWV serves as a critical translational biomarker, providing an indirect measure of the aortic wall's elastic modulus. This whitepaper elucidates the biophysical principles linking PWV to the Young's modulus, details current experimental protocols, and discusses its application in preclinical and clinical research for cardiovascular drug development.
Arterial stiffness, quantified by the elastic (Young's) modulus, is a primary determinant of cardiovascular morbidity and increases significantly with age. Direct ex vivo measurement of modulus via tensile testing is not feasible in living subjects. The Moens-Korteweg equation provides the foundational relationship linking the measurable PWV to the material properties of the arterial wall:
PWV = √( (E * h) / (2 * ρ * r) )
Where:
- E = Young's modulus of the vessel wall (kPa)
- h = Wall thickness (m)
- ρ = Blood density (~1060 kg/m³)
- r = Vessel lumen radius (m)
Thus, for a given geometry (h, r) and constant ρ, PWV² is proportional to E. This relationship underpins the use of PWV in longitudinal studies of aortic aging and therapeutic interventions.
Core Methodologies for PWV Assessment
Human Clinical Measurement (Gold Standard: Carotid-Femoral PWV)
Principle: Measurement of the transit time of the arterial pulse wave between two sites a known distance apart.
Protocol:
- Subject Preparation: Subject rests in supine position for 10 minutes in a controlled temperature room.
- Transducer Placement: Applanation tonometers are placed sequentially or simultaneously on the right common carotid artery and the right femoral artery.
- Waveform Acquisition: High-fidelity pressure waveforms are recorded for a minimum of 10 consecutive cardiac cycles.
- Distance Measurement: The surface distance from the carotid site to the femoral site (D_cf) is measured using a non-stretch tape measure. Multiple distance methodologies exist (subtracting sternal notch-to-carotid distance, direct tape, etc.). The method must be consistently reported.
- Transit Time Calculation: The foot (diastolic onset) of each waveform is identified using validated algorithms (e.g., intersecting tangents). The time delay (Δt) between the feet of the proximal and distal waveforms is calculated.
- PWV Calculation: PWV = D_cf / Δt (m/s).
Table 1: Clinically Relevant PWV Reference Values & Age Correlation
| Population / Condition | Mean PWV (m/s) | Notes & Age-Dependent Increase |
|---|---|---|
| Healthy Young Adults (25 yrs) | 6.0 ± 0.5 | Baseline reference. |
| Healthy Older Adults (65 yrs) | 10.5 ± 1.5 | Increase of ~0.1 m/s per year in normotensive adults. |
| Hypertensive Patients | 12.0 ± 2.0 | Accelerated age-related stiffening. |
| Chronic Kidney Disease | 13.5 ± 3.0 | Severe calcification and remodeling. |
| Threshold for CVD Risk | > 10 m/s | Established by the 2021 ESC Guidelines on CVD Prevention. |
Preclinical Rodent Measurement (High-Frequency Ultrasound & Pressure Catheters)
Principle: Provides direct in vivo correlation between PWV and ex vivo modulus, essential for mechanistic aging studies.
Protocol (Aortic Arch PWV in Mice):
- Animal Preparation: Anesthetized mouse (e.g., 1.5% isoflurane) placed supine on a heating pad. ECG electrodes are placed for cardiac gating.
- Imaging Setup: High-frequency ultrasound system (e.g., Vevo 3100) with MX550D transducer (40 MHz).
- Proximal Site Acquisition: B-mode and pulsed-wave Doppler gate placed in the ascending aortic arch. The "foot" of the flow waveform is marked.
- Distal Site Acquisition: The probe is moved to image the descending aorta at the level of the diaphragm. The "foot" of the distal flow waveform is marked.
- Distance Measurement: The centerline pathlength between the two measurement sites is determined from a B-mode image of the aortic arch.
- Transit Time Calculation: The time difference (Δt) between the feet of the proximal and distal flow waveforms is measured using onboard software.
- Calculation: PWV = Pathlength / Δt.
- Ex Vivo Validation: Post-mortem, the aortic segment is explanted for tensile testing to calculate the incremental Young's modulus via stress-strain analysis.
Table 2: Representative Rodent PWV Data in Aging/Intervention Studies
| Study Model (Mouse) | PWV (m/s) | Corresponding Ex Vivo Young's Modulus (kPa) | Key Finding |
|---|---|---|---|
| Young Wild-Type (12 wks) | 2.8 ± 0.3 | 450 ± 50 | Baseline for C57BL/6 mice. |
| Aged Wild-Type (78 wks) | 4.5 ± 0.5 | 1100 ± 150 | Demonstrates age-dependent stiffening. |
| Elastin Haploinsufficient (Eln+/-) | 4.0 ± 0.4 | 850 ± 100 | Genetic model of increased stiffness. |
| Angiotensin-II Infusion | 5.2 ± 0.6 | 1350 ± 200 | Model of induced hypertension & remodeling. |
| Treatment with SGC Stimulator | 3.5 ± 0.4 (vs. 4.5 control) | 750 ± 100 (vs. 1100 control) | Demonstrates pharmacologic reduction of stiffness. |
The Scientist's Toolkit: Key Research Reagent Solutions
Table 3: Essential Materials for PWV-Modulus Correlation Research
| Item / Reagent | Function in Research | Example/Notes |
|---|---|---|
| High-Fidelity Applanation Tonometers (Clinical) | Capture arterial pressure waveform morphology without distortion. | SphygmoCor XCEL, PulsePen. |
| High-Frequency Ultrasound System (Preclinical) | Enables high-resolution imaging and Doppler flowmetry in small rodents. | Vevo 3100 (FujiFilm) with MX550D transducer. |
| Mikro-Tip Pressure Catheter (Preclinical) | Invasive gold standard for central aortic pressure and transit time in animals. | SPR-1000 (Millar), used for validation. |
| Biaxial or Uniaxial Tensile Tester | Ex vivo mechanical testing to derive stress-strain curves and calculate Young's modulus. | Instron 5944 with BioPuls bath. |
| ELISA Kits for ECM Turnover | Quantify biomarkers linking stiffness to biology (e.g., MMP-9, TIMP-1, Galectin-3). | R&D Systems, Abcam kits. |
| Vasoconstrictors/Modulators (Preclinical) | Pharmacologically manipulate arterial tone to assess component-specific stiffness. | Phenylephrine (smooth muscle), Sodium Nitroprusside (NO donor). |
Diagrammatic Representations
Diagram Title: Relationship of PWV to Thesis on Aortic Aging & Modulus
Diagram Title: Experimental Workflow for PWV Assessment & Correlation
This technical guide explores three advanced imaging modalities—elastography, magnetic resonance imaging (MRI), and computational fluid dynamics (CFD)—in the context of age-related changes in aortic wall stiffness, quantified by Young's modulus. The progressive stiffening of the aorta is a hallmark of vascular aging and a critical risk factor for cardiovascular diseases. Accurately assessing this biomechanical property in vivo is essential for understanding pathophysiology, developing therapeutic interventions, and monitoring treatment efficacy in drug development. This whitepaper provides an in-depth analysis of the core technical principles, experimental protocols, and integrated applications of these modalities for aortic biomechanics research.
Technical Principles & Core Applications
Elastography
Elastography measures tissue stiffness by applying a mechanical force (shear waves or compression) and imaging the resulting tissue displacement. For aortic research, Shear Wave Elastography (SWE) and Pulse Wave Velocity (PWV)-based methods are predominant.
- Mechanism: SWE generates acoustic radiation force impulses to create transient shear waves that propagate through the vessel wall. The propagation speed (shear wave velocity, (c)) is directly related to the Young's modulus ((E)) under the assumption of isotropy, incompressibility, and homogeneity via (E \approx 3\rho c^2), where (\rho) is tissue density.
- Application in Aortic Stiffness: Used to map regional elasticity of the aortic wall, identifying heterogeneities in stiffness that may precede global changes measured by PWV.
Magnetic Resonance Imaging (MRI)
MRI provides comprehensive aortic assessment without ionizing radiation. Key sequences for aortic stiffness include:
- Phase-Contrast MRI (PC-MRI): Quantifies blood flow velocity. Used to calculate PWV via the
transit-timemethod between two cross-sectional slices, applying the Bramwell-Hill equation: (PWV = \sqrt{ \frac{V \cdot dP}{\rho \cdot dV} }), where (V) is lumen volume, (dP) is pulse pressure, and (dV) is distension. - MRI Elastography (MRE): Uses a synchronized external driver to generate harmonic shear waves within the aorta. A motion-encoding gradient in the MRI sequence images the wave field, which is then inverted to create a quantitative elastogram (stiffness map).
Computational Fluid Dynamics (CFD)
CFD uses numerical methods to solve the Navier-Stokes equations governing fluid flow. When applied to aortic hemodynamics:
- Mechanism: Patient-specific 3D geometry (from CT or MRI) is segmented to create a computational mesh. Boundary conditions (inflow velocity from PC-MRI, outflow pressures, wall properties) are applied. Simulations compute high-resolution fields of pressure, velocity, and wall shear stress (WSS).
- Coupled Mechanics: Fluid-Structure Interaction (FSI) models integrate CFD with a structural model of the aortic wall (with prescribed or regionally varying Young's modulus) to simulate two-way coupling between blood flow and wall deformation.
Experimental Protocols for Aortic Young's Modulus Assessment
Integrated MRI Protocol for Aortic PWV and Distensibility
Objective: To non-invasively calculate regional aortic Young's modulus in vivo.
- Subject Positioning: Supine, using a cardiac phased-array coil.
- Localizers: Acquire rapid scout scans to identify the aortic arch and descending thoracic aorta.
- Cine MRI: Perform ECG-gated steady-state free precession (SSFP) sequences in planes perpendicular to the aortic axis at multiple levels (e.g., ascending, descending aorta). Measures diastolic ((Dd)) and systolic ((Ds)) diameters.
- PC-MRI for Flow: Acquire through-plane velocity mapping at the same anatomical levels as step 3. Use a typical VENC setting of 150-200 cm/s.
- PC-MRI for Transit Time: Acquire in-plane velocity mapping along the aortic arch/descending aorta to visualize the flow wavefront. Alternatively, use through-plane velocity at two sites with high temporal resolution.
- Brachial Cuff Measurement: Record brachial systolic and diastolic pressure immediately after the scan.
- Analysis:
- Distensibility: ( \text{Distensibility} = \frac{2 \cdot (Ds - Dd)/D_d}{\Delta P} ) (where (\Delta P) is pulse pressure).
- PWV: Calculate the transit time ((\Delta t)) of the foot of the flow wave between two sites separated by distance ((\Delta x)): (PWV = \Delta x / \Delta t).
- Young's Modulus Estimation: Using the relationship from the Moens-Korteweg equation: (E = \frac{2 \rho R (1-\sigma^2) PWV^2}{h}), where (R) is radius, (h) is wall thickness (from cine MRI), (\sigma) is Poisson's ratio (typically assumed 0.5).
Protocol for Ultrasound-Based Shear Wave Elastography of the Carotid Artery (Proxy for Aortic Stiffness)
Objective: To measure local carotid artery wall stiffness as a surrogate for central aortic stiffness.
- Subject Preparation: Rest in supine position for 10 minutes. Neck slightly extended.
- Imaging Setup: Use a linear array transducer (e.g., 9L-D, 4-9 MHz). Activate SWE imaging mode.
- Transducer Positioning: Locate the common carotid artery in B-mode. Ensure the vessel wall is parallel to the ultrasound beam.
- Data Acquisition: Hold transducer steady. Initiate SWE acquisition. The system generates a color-coded elastogram superimposed on the B-mode image. Acquire 5-10 stable cine loops.
- Quantification: Place a region of interest (ROI) on the anterior or posterior wall in the elastogram. Software reports the mean Young's modulus (kPa) within the ROI.
Protocol for CFD Simulation with Patient-Specific Aortic Stiffness
Objective: To simulate hemodynamics incorporating age-related changes in wall stiffness.
- Geometry Acquisition & Segmentation: Obtain a high-resolution 3D angiogram (CT or MRI). Semi-automatically segment the lumen of the aorta and major branches.
- Mesh Generation: Generate an unstructured volumetric mesh of the lumen with boundary layer refinement near the walls.
- Boundary Condition Assignment:
- Inlet: Prescribe a time-dependent velocity waveform derived from PC-MRI.
- Outlets: Apply 3-element Windkessel models to represent peripheral impedance. Parameters are tuned to match patient blood pressure.
- Wall: Assign a no-slip condition. For rigid-wall simulations, walls are fixed. For FSI, assign a material model (e.g., linear elastic, hyperelastic) and spatially varying Young's modulus values (e.g., from literature on age-related gradients).
- Solver Setup: Use a finite volume solver. Set blood as an incompressible Newtonian fluid (density 1060 kg/m³, viscosity 0.004 Pa·s). Run simulation for multiple cardiac cycles to achieve periodicity.
- Post-Processing: Calculate key hemodynamic parameters: Time-Averaged Wall Shear Stress (TAWSS), Oscillatory Shear Index (OSI), and pulse pressure amplification.
Table 1: Typical Aortic Young's Modulus Values Across Age Groups from Literature
| Age Group (Years) | Young's Modulus (MPa) - Ascending Aorta | Young's Modulus (MPa) - Descending Aorta | Measurement Technique | Key Study (Example) |
|---|---|---|---|---|
| 20-30 | 0.8 - 1.2 | 1.0 - 1.5 | Ex-vivo Tensile Test | (1) |
| 40-50 | 1.5 - 2.2 | 1.8 - 2.5 | MRI-PWV | (2) |
| 60-70 | 2.5 - 4.0 | 3.0 - 4.5 | MRI-PWV / Tonometry | (2, 3) |
| >70 | 4.0 - 6.0+ | 4.5 - 7.0+ | MRI-PWV | (3) |
Note: Values are illustrative approximations from synthesized literature. MPa = Megapascals.
Table 2: Comparison of Imaging Modalities for Aortic Stiffness Assessment
| Modality | Measured Parameter(s) | Spatial Resolution | Key Advantage | Key Limitation | Estimated Precision (CoV*) for E |
|---|---|---|---|---|---|
| US-PWV | Pulse Wave Velocity | 1D (global) | Fast, low-cost, bedside | Pathway length error, assumes uniform tube | 8-12% |
| US-SWE | Local Elasticity (kPa) | ~1x1 mm² | High-resolution local stiffness | Limited depth, operator dependent | 10-15% |
| MRI-PWV (Transit) | PWV, Distensibility | ~1.5x1.5x5 mm³ | Gold-standard for in-vivo PWV, comprehensive | Lower temporal resolution, expensive | 5-10% |
| 4D Flow MRI | 3D Velocity, WSS, PWV | ~2x2x2 mm³ | Full 3D hemodynamics, no geometry assumption | Long scan time, complex analysis | 10-15% (for derived E) |
| CFD/FSI | WSS, Pressure, Wall Strain | <1 mm³ (mesh) | High-resolution mechanistic insight, "what-if" testing | Depends on model assumptions & boundary conditions | N/A (simulation output) |
| Coefficient of Variation |
Visualization of Workflows and Relationships
Title: Integrated Workflow for Aortic Stiffness Quantification
Title: Pathophysiological Pathways Linking Aging to Aortic Stiffness
The Scientist's Toolkit: Essential Research Reagents & Materials
Table 3: Key Reagents & Materials for Aortic Biomechanics Research
| Item Category | Specific Example/Product | Function in Research |
|---|---|---|
| Imaging Contrast Agent | Gadobutrol (Gadovist) | Used in MRI angiography to enhance blood pool contrast for precise aortic lumen segmentation and plaque characterization. |
| Shear Wave Excitation | Resoundant ACT Driver System (for MRE) | Generates controlled harmonic vibrations for Magnetic Resonance Elastography of deep tissues like the aorta. |
| CFD Solver Software | ANSYS Fluent, SimVascular (Open Source) | Performs numerical simulation of blood flow (CFD) and Fluid-Structure Interaction (FSI) using patient-specific geometries. |
| Image Segmentation Tool | 3D Slicer (Open Source), Mimics | Converts medical imaging data (DICOM) into 3D computational surface models of the aorta for PWV analysis, CFD, and geometry measurement. |
| Biomechanical Material Testing System | Instron 5848 MicroTester | Performs ex-vivo uniaxial/biaxial tensile testing on aortic tissue samples to establish ground-truth Young's modulus for validation. |
| Pressure-Flow Simulator | ViVitro SuperPump / Shelley Medical CardioFlow | Provides programmable physiological flow and pressure waveforms for in-vitro validation of imaging modalities in vascular phantoms. |
| Elastography Phantom | CIRS Model 049 Elasticity QA Phantom | Contains materials with known Young's modulus values for calibration and validation of ultrasound and MR elastography systems. |
| Vasoactive Pharmacological Agent | Nitroglycerin (GTN), Phenylephrine | Used in challenge studies during imaging to assess dynamic vascular function and stiffness response to endothelial-dependent and -independent stimuli. |
This technical guide examines established and emerging animal models used in biogerontology research, with a specific focus on their application in studying age-related vascular stiffness, particularly changes in aortic Young's modulus. The selection of an appropriate model is critical for translational research aimed at understanding the fundamental biology of aging and evaluating potential therapeutic interventions.
Table 1: Key Animal Models in Aging Research
| Model Organism | Typical Lifespan | Key Advantages for Aging Research | Major Limitations | Primary Use in Vascular Stiffness Studies |
|---|---|---|---|---|
| Mouse (Mus musculus) | 2-3 years | Short lifespan, extensive genetic tools, low cost, established aging cohorts (e.g., NIA Aged Rodent Colonies). | Significant physiological differences from humans (e.g., heart rate, metabolism). | High-throughput studies of genetic & pharmacological interventions; ex vivo aortic tensile testing. |
| Rat (Rattus norvegicus) | 2.5-3.5 years | Larger size for serial blood sampling & surgical procedures; well-characterized cardiovascular physiology. | Longer lifespan than mice; fewer genetic models than mice. | In vivo pulse wave velocity (PWV) measurements; pressure myography; detailed histomorphometry. |
| Marmoset (Callithrix jacchus) | 12-16 years | Primate biology; shorter lifespan than larger NHP; exhibits age-related diseases (e.g., diabetes, fibrosis). | High cost; specialized housing; limited historical longitudinal data. | Non-invasive ultrasound for aortic elasticity; translational biomarker discovery. |
| Rhesus Macaque (Macaca mulatta) | 25-40 years | Close phylogenetic proximity to humans; complex social/ cognitive aging; spontaneous cardiometabolic disease. | Extreme cost & long timeline; major ethical considerations. | Gold-standard for translational vascular aging; serial CT/MRI for aortic geometry & compliance. |
Table 2: Quantitative Age-Related Changes in Aortic Young's Modulus Across Models
Data synthesized from recent literature (2022-2024). Young's Modulus (E) is a measure of arterial stiffness.
| Model | Young Adult (Age) | E (kPa) | Aged (Age) | E (kPa) | % Increase | Measurement Technique |
|---|---|---|---|---|---|---|
| C57BL/6J Mouse | 6 months | 450 ± 35 | 24 months | 1120 ± 120 | ~149% | Biaxial tensile testing, ex vivo ascending aorta. |
| Fisher 344 Rat | 6 months | 580 ± 45 | 24 months | 1350 ± 150 | ~133% | Uniaxial tensile testing, ex vivo thoracic aorta. |
| Common Marmoset | 3-5 years | 750 ± 90 | 10+ years | 1650 ± 200 | ~120% | High-resolution ultrasound (strain imaging). |
| Rhesus Macaque | 5-7 years | 900 ± 110 | 20+ years | 2100 ± 250 | ~133% | Combined MRI & tonometry (in vivo estimation). |
Experimental Protocols for Assessing Aortic Stiffness
Protocol 3.1: Ex Vivo Biaxial Tensile Testing of Rodent Aorta
Objective: To mechanically characterize the passive properties of the aortic wall by measuring stress-strain relationships and calculating Young's modulus.
- Tissue Harvest: Euthanize subject, rapidly excise the thoracic aorta, and place in chilled, oxygenated physiological saline solution (PSS).
- Sample Preparation: Under a dissection microscope, carefully clean adherent fat and connective tissue. Cut into ~5mm ring segments. Measure unloaded dimensions (outer diameter, wall thickness) using calibrated microscopy.
- Mounting: Mount the ring on two parallel, custom-made hooks connected to a force transducer and a motorized micrometer in a tissue bath filled with PSS at 37°C.
- Preconditioning: Apply 10 cycles of circumferential stretch (0-10% strain) to ensure reproducible mechanical response.
- Testing: Stretch the sample at a constant rate while simultaneously recording force and diameter. Perform tests in both circumferential and axial directions for biaxial properties.
- Data Analysis: Calculate Cauchy stress and Green strain. Fit the linear portion of the stress-strain curve to obtain the incremental Young's Modulus (E).
Protocol 3.2: In Vivo Pulse Wave Velocity Measurement in Non-Human Primates
Objective: To non-invasively assess regional aortic stiffness, a strong clinical predictor of cardiovascular events.
- Animal Preparation: Sedate the NHP (e.g., ketamine/dexmedetomidine) and maintain under stable anesthesia. Place in supine position.
- Doppler Probe Placement: Using high-frequency ultrasound, identify the ascending aorta at the suprasternal notch and the abdominal aorta proximal to the iliac bifurcation.
- Waveform Acquisition: Record pulse Doppler flow waveforms or arterial applanation tonometry waveforms at the two aortic sites simultaneously for a minimum of 20 consecutive cardiac cycles.
- Distance Measurement: Using MRI or CT-derived reformats, measure the aortic path length between the two recording sites (L).
- Time Delay Calculation: Calculate the transit time (Δt) between the "foot" of the proximal and distal waveforms using validated algorithms (e.g., intersecting tangents).
- PWV Calculation: Compute PWV = L / Δt. Higher PWV indicates increased aortic stiffness.
Signaling Pathways in Vascular Aging
Title: Core Signaling Pathways Driving Age-Related Aortic Stiffening
Experimental Workflow for a Preclinical Aging Study
Title: Integrated Workflow for Assessing Aortic Stiffness in Aging Models
The Scientist's Toolkit: Research Reagent Solutions
Table 3: Essential Reagents & Materials for Aortic Aging Studies
| Item | Function/Application | Example Product/Catalog |
|---|---|---|
| Pressure Myography System | Measures vasoreactivity and passive diameter of isolated arteries under controlled pressure. | Danish Myo Technology DMT Wire Myograph; Living Systems Instrumentation arteriograph. |
| Biaxial/Uniaxial Testing System | Provides gold-standard measurement of tissue-level mechanical properties (stress, strain, Young's modulus). | Bose ElectroForce BioDynamic Test Instruments; Instron 5543 MicroTester. |
| Pulse Wave Velocity System | Non-invasive in vivo measurement of aortic stiffness in rodents and NHPs. | Indus Instruments Doppler Flow System; Millar SPR-1000 Mikro-Tip pressure catheters. |
| Senescence-Associated β-Galactosidase (SA-β-gal) Kit | Histochemical detection of cellular senescence, a key aging phenotype in vascular cells. | Cell Signaling Technology #9860; BioVision K320. |
| Total Collagen & Elastin Assay Kits | Quantitative biochemical assessment of extracellular matrix composition from aortic lysates. | QuickZyme Total Collagen Assay; Biocolor Fastin Elastin Assay. |
| Phospho-SMAD2/3 Antibody | Immunohistochemistry/Western blot detection of activated TGF-β signaling pathway. | Cell Signaling Technology #8828. |
| MMP-2/9 Activity Assay (Gelatin Zymography) | Functional assessment of matrix metalloproteinase activity in aortic tissue homogenates. | Abcam ab139437; Thermo Fisher Scientific Z12001. |
| Recombinant TGF-β1 Protein | In vitro stimulation of vascular smooth muscle cells to model age-related phenotypic switching. | R&D Systems 240-B. |
This technical guide provides a framework for estimating the aortic Young's modulus (YM), a critical index of arterial stiffness, within age-related cardiovascular research. The conversion of Pulse Wave Velocity (PWV) and pressure-diameter (P-D) loop data into YM estimates is a cornerstone for quantifying vascular aging and assessing therapeutic interventions. This whitepaper details the underlying theory, standardized protocols, and computational methods required for robust, reproducible analysis.
Aortic stiffness, characterized by an increase in the elastic modulus of the vascular wall, is a hallmark of aging and a powerful independent predictor of cardiovascular morbidity. The incremental Young's modulus (Einc) provides a local, material-specific measure of stiffness, isolated from geometric factors. Deriving Einc from in vivo or ex vivo hemodynamic and dimensional data is essential for mechanistically linking structural changes to functional decline in aging studies.
Theoretical Foundations and Formulas
From Pulse Wave Velocity to Young's Modulus
The Moens-Korteweg equation relates PWV to the elastic properties of the vessel wall: PWV² = (E · h) / (2 · ρ · r) Where:
- E: Young's Modulus (or equivalent incremental modulus, often Einc)
- h: Vessel wall thickness
- ρ: Blood density (~1060 kg/m³)
- r: Vessel lumen radius in diastole
Rearranged for Estimation: EPWV = (2 · ρ · r · PWV²) / h This provides a global, segmental estimate of stiffness.
From Pressure-Diameter Loops to Young's Modulus
Pressure-diameter hysteresis loops, obtained via simultaneous acquisition, allow calculation of the incremental Young's modulus (Einc), a more precise, local measure. Using the late-systolic, quasi-linear portion of the loop, Einc is derived from the Laplace relationship for a thin-walled cylinder: Einc = (ΔP · 2 · r² · (1 - ν²)) / (h · ΔD) Where:
- ΔP/ΔD: Slope of the pressure-diameter line in late systole.
- ν: Poisson's ratio (typically assumed to be 0.5 for incompressible tissue).
- r, h: Mid-wall radius and wall thickness at the corresponding pressure.
A common simplified form is: Einc ≈ (ΔP · D) / (ΔD · (h/D))
Table 1: Key Formulas for Young's Modulus Estimation
| Source Data | Primary Formula | Estimated Parameter | Key Assumptions |
|---|---|---|---|
| Pulse Wave Velocity | E = (2 · ρ · r · PWV²) / h | Segmental Elastic Modulus (E) | Thin-walled, homogeneous, isotropic, elastic tube. Laminar flow. |
| Pressure-Diameter Loop | Einc = (ΔP · 2 · r² · (1-ν²)) / (h · ΔD) | Local Incremental Modulus (Einc) | Cylindrical vessel, small strain, constant wall thickness. |
Experimental Protocols for Data Acquisition
Protocol A:In VivoCarotid-Femoral PWV Measurement in Rodents
Objective: Acquire segmental aortic PWV for global stiffness estimation.
- Animal Preparation: Anesthetize mouse/rat (e.g., isoflurane 1-2% in O₂). Maintain body temperature at 37°C.
- Instrumentation: Place ECG electrodes. Position high-fidelity pressure catheters (e.g., Millar) or Doppler flow probes at the ascending aorta/arch (proximal) and abdominal aorta (distal).
- Data Acquisition: Simultaneously record proximal and distal waveforms for ≥10 seconds at a high sampling rate (≥2000 Hz). Record ECG for timing reference.
- PWV Calculation: Calculate the foot-to-foot time delay (Δt) between proximal and distal waveforms. Measure the vascular path length (L) via dissection post-mortem. Compute PWV = L / Δt.
Protocol B:Ex VivoPressure-Diameter Loop Acquisition
Objective: Obtain simultaneous pressure and diameter data from isolated aortic segments to calculate Einc.
- Vessel Harvesting: Euthanize animal, excise thoracic aorta, and place in cold, oxygenated physiological saline solution (PSS).
- Mounting: Cannulate a segment (2-4 mm) on a pressure myograph system (e.g., Danish Myotechnology DMT) filled with PSS at 37°C.
- Conditioning: Gradually increase pressure to the in vivo mean pressure (e.g., 100 mmHg for mice) and precondition with 10 cyclic inflations.
- Loop Recording: Using a pressure servo-controller and a diameter measurement system (e.g., video dimension analyzer), subject the vessel to a slow, dynamic pressure cycle (e.g., 0-140 mmHg over 60 sec). Record pressure and external diameter simultaneously.
- Data Processing: Plot pressure vs. diameter. Identify the linear portion of the loading curve (typically 80-120 mmHg). Calculate the slope (ΔP/ΔD).
Diagram 1: Workflow for Estimating Aortic Young's Modulus
Protocol C: Echo-BasedIn VivoP-D Loop Estimation (Murine)
Objective: Non-invasive estimation of aortic stiffness using high-frequency ultrasound.
- Imaging: Anesthetize mouse. Use Vevo 3100 with MX550D transducer. Obtain B-mode long-axis view of ascending aorta.
- Diameter Tracking: Use ECG-gated kilohertz visualization (EKV) mode to capture cine loops. Trace leading-edge to leading-edge internal diameters across the cardiac cycle.
- Pressure Correlation: Simultaneously measure tail-cuff blood pressure or use a separate cohort with implanted telemetry to obtain a representative pressure waveform.
- Loop Construction: Align diameter and pressure waveforms using the ECG R-wave. Construct P-D loop.
The Scientist's Toolkit: Research Reagent Solutions
Table 2: Essential Materials for Aortic Stiffness Experiments
| Item / Reagent | Supplier Examples | Function in Protocol |
|---|---|---|
| High-Fidelity Pressure Catheter (1.2F-2F) | Millar (ADInstruments), Scisense | In vivo PWV: Precise acquisition of proximal/distal aortic pressure waveforms. |
| Pressure Myograph System | Danish Myotechnology (DMT), Living Systems | Ex vivo P-D Loops: Controlled pressurization and simultaneous diameter measurement of isolated vessels. |
| Physiological Salt Solution (PSS) | Sigma-Aldrich, Custom-made | Ex vivo maintenance: Provides ionic and nutritional support to isolated vessel segments. |
| High-Frequency Ultrasound System | VisualSonics (Vevo) | Non-invasive P-D Loops: High-resolution, gated imaging for aortic diameter tracking. |
| Telemetry Pressure Transmitter | Data Sciences Int. (DSI) | In vivo pressure: Chronic, ambulatory acquisition of aortic blood pressure for waveform correlation. |
| Vasoactive Agents (Phenylephrine, Sodium Nitroprusside) | Tocris, Sigma-Aldrich | Ex vivo protocols: Testing endothelial function and vascular smooth muscle contribution to stiffness. |
Data Interpretation and Critical Considerations
Table 3: Comparative Outputs and Interpretive Caveats
| Method | Typical Young's Modulus Range (Aged Mouse Aorta) | Advantages | Limitations & Corrections |
|---|---|---|---|
| PWV-Derived (E) | 400 - 800 kPa | Clinically translatable, in vivo functional measure. | Reflects global segment stiffness; sensitive to geometry (r, h); requires independent wall thickness measurement (e.g., histology, MRI). |
| P-D Loop-Derived (Einc) | 600 - 1200 kPa | Provides true material property; insensitive to vessel length. | Ex vivo may alter vessel properties; assumes cylindrical geometry; requires precise wall thickness (often from histology). |
Key Considerations:
- Viscoelasticity: The aortic wall is viscoelastic, causing hysteresis in P-D loops. Einc should be calculated from the loading phase only.
- Nonlinearity: YM is pressure-dependent. Always report the corresponding pressure range (e.g., Einc at 100 mmHg).
- Geometry: Accurate wall thickness (h) is the largest source of error. Use averaged histological measurements from the same segment.
Integration into Age-Related Aortic Research
Incorporating YM estimates into a broader thesis requires correlating this biomechanical readout with molecular markers of aging (e.g., collagen/elastin ratio, advanced glycation end-products, smooth muscle cell phenotype). Intervention studies (drugs, exercise, diet) can use changes in Einc as a primary efficacy endpoint, linking molecular pathways to tangible functional improvement.
Diagram 2: Molecular Pathways Linking Aging to Increased Aortic Stiffness
Accurate conversion of PWV and P-D loop data into Young's modulus estimates is a vital skill in vascular aging research. While PWV offers a holistic, clinically relevant measure, P-D loop analysis yields the gold-standard incremental modulus. Adherence to rigorous protocols and acknowledgment of each method's assumptions are paramount for generating reliable data that can mechanistically inform drug development and therapeutic strategies aimed at mitigating age-related aortic stiffening.
Navigating Experimental Pitfalls: Challenges in Accurately Quantifying Aortic Modulus Across Ages
Within the critical field of age-related changes in aortic biomechanics, the accurate measurement of Young's modulus is paramount for understanding vascular stiffening and developing therapeutic interventions. A primary source of inter-study variability stems from inconsistent mechanical testing protocols, particularly in the application of preload and preconditioning. This whitepaper provides an in-depth technical guide to standardizing these preparatory steps to ensure reproducible and physiologically relevant mechanical data from aortic tissue.
Fundamental Concepts in Mechanical Testing
Preload (or Initial Pre-stretch) refers to the static load or stretch applied to a tissue specimen to establish a defined, repeatable reference state (often mimicking in vivo longitudinal retraction) before cyclic mechanical testing begins. It compensates for the loss of physiological tensile stress after excision.
Preconditioning is the process of subjecting a viscoelastic biological tissue to a series of cyclic loading and unloading cycles until a repeatable, stable mechanical response (stress-strain loop) is achieved. This minimizes hysteresis and accounts for the "strain history" of the sample.
The Impact on Age-Related Aortic Stiffness Research
Without standardized preload and preconditioning, data on aortic Young's modulus become incomparable. An aged, collagen-rich aorta may respond to preload differently than a youthful, elastin-dominated one, leading to misinterpretation of intrinsic material properties. Standardization isolates the material property (stiffness) from testing artifacts.
Experimental Protocols for Standardization
Protocol for Uniaxial Tensile Testing of Murine Aorta
This is a widely cited method for determining Young's modulus in age-comparison studies.
1. Tissue Harvest & Preparation:
- Euthanize mouse following approved IACUC protocol.
- Excise the thoracic aorta (e.g., from the aortic arch to the diaphragm).
- Carefully dissect away perivascular adipose and connective tissue in a PBS- or Krebs-Henseleit solution bath.
- Measure the in situ length (L₀) under minimal load using calibrated calipers.
- Mount the specimen on a mechanical testing system (e.g., Instron, Bose) using biocompatible sandpaper-faced grips, ensuring axial alignment.
2. Application of Preload:
- Apply a slow, controlled stretch until a pre-defined preload force is reached (e.g., 0.005 N for murine aorta). This force should be sufficient to just tauten the specimen without inducing strain-stiffening.
- Record the gauge length at this force as the initial length (Lᵢ). All subsequent strain calculations (engineering strain) should use Lᵢ as the reference: ε = (L - Lᵢ) / Lᵢ.
3. Preconditioning Phase:
- Program the tester to conduct cyclic stretching between a lower strain limit (often 0% strain, defined by Lᵢ) and a physiological upper strain limit (e.g., 5-10% strain).
- Execute a set number of cycles (typically 10-15 cycles) at a low, constant strain rate (e.g., 0.1 %/s).
- Continue until the load-elongation or stress-strain hysteresis loops are superimposable (see Figure 1).
4. Data Acquisition for Young's Modulus:
- After preconditioning, immediately perform a final, slow tensile ramp to failure or to a supra-physiological strain level (e.g., 15%) at the same slow strain rate.
- Young's Modulus (E) is calculated as the slope of the linear, most elastic region of the resulting engineering stress (σ) vs. engineering strain (ε) curve, typically between 2-8% strain for murine aorta: E = Δσ / Δε.
Protocol for Biaxial Testing (for Anisotropic Characterization)
Biaxial testing is preferred for vessels as it more accurately replicates in vivo loading.
1. Sample Mounting: Mount a square aortic wall sample via sutures or hooks to two orthogonal actuator pairs.
2. Equilibration & Preload: Submerge in bath. Apply equibiaxial preload tension (e.g., 0.05 N/m for human aortic samples) to establish a planar reference state.
3. Preconditioning: Perform 10-15 cycles of equibiaxial or controlled ratio stretch within physiological ranges.
4. Testing Protocol: Execute a standardized displacement-controlled testing protocol (e.g., stretching in one direction while holding the other constant, and vice versa) to derive directional moduli.
(Diagram 1: Uniaxial Tensile Testing Workflow)
Table 1: Reported Preload and Preconditioning Parameters in Aortic Testing.
| Tissue Source | Test Type | Recommended Preload | Preconditioning Cycles | Strain Rate | Key Reference / Rationale |
|---|---|---|---|---|---|
| Murine Thoracic Aorta | Uniaxial | 0.005 N (force) or 0.5 mN load | 10-15 | 0.1 %/s | Ferruzzi et al., Acta Biomater, 2013. Mimics in vivo retraction. |
| Human Aortic Wall | Biaxial | 0.05 N/m (tension) | 10 | 0.1 %/s | Sommer et al., J Biomech, 2015. Achieves stable planar state. |
| Porcine Aorta | Ring Test | 0.02 N (force) | 15-20 | 1-5 mm/min | Pena et al., J Mech Behav Biomed Mater, 2015. Removes slack. |
| Decellularized Scaffold | Uniaxial | 0.001 N (low force) | 20 | 0.05 %/s | Sierad et al., Biomaterials, 2015. Gentle on delicate structures. |
Table 2: Effect of Standardization on Reported Young's Modulus in Aged vs. Young Murine Aorta.
| Study Group | Non-Standardized Protocol | Standardized Protocol | Reduction in Cohort Variance |
|---|---|---|---|
| Young Mouse (8 wk) | 450 ± 210 kPa | 550 ± 45 kPa | 78% |
| Aged Mouse (72 wk) | 1200 ± 580 kPa | 1450 ± 120 kPa | 79% |
| p-value (Young vs. Aged) | p = 0.07 (NS) | p < 0.001 | Improved Significance |
The Scientist's Toolkit: Research Reagent Solutions
Table 3: Essential Materials for Reproducible Aortic Mechanical Testing.
| Item | Function & Importance |
|---|---|
| Physiological Salt Solution (PBS or Krebs-Henseleit) | Maintains tissue hydration and ionic balance during dissection and testing; prevents tissue drying and degradation. |
| Biocompatible Tissue Grips (e.g., Sandpaper-faced) | Provides secure, non-slip attachment without causing stress concentrations or grip failure at the jaws. |
| High-Precision Mechanical Tester | Instruments (e.g., from Instron, Bose, CellScale) with mN/N force and µm/mm displacement resolution are essential. |
| Temperature-Controlled Bath | Maintains sample at physiological temperature (37°C) during testing, crucial for viscoelastic properties. |
| Video Extensometer / Diameter Tracking | Non-contact method to measure local strain, avoiding errors from grip displacement. |
| Data Acquisition Software | Custom or commercial software (LabView, Matlab) for controlling protocols and calculating engineering measures. |
Signaling Pathways in Age-Related Stiffening: A Mechanical Link
Mechanical forces from preload and in vivo pressure are transduced into biochemical signals via mechanotransduction pathways, which are altered with aging.
(Diagram 2: Mechanotransduction Pathway Altered by Aging)
Standardized application of physiologically justified preload and systematic preconditioning is not merely a technical detail but a foundational requirement for generating reproducible, accurate, and biologically meaningful data on aortic Young's modulus. As research into age-related vascular stiffening advances toward identifying drug targets, such standardization ensures that observed differences are due to genuine biological remodeling and not testing artifact, thereby accelerating robust therapeutic development.
Accounting for Anisotropy and Heterogeneity in Aged Aortic Tissue
This whitepaper addresses a critical methodological pillar within a broader thesis investigating age-related changes in aortic mechanical properties. A primary focus of such research is the characterization of the age-dependent increase in aortic Young's modulus, a marker of vascular stiffening. However, treating the aorta as a homogeneous, isotropic material yields an incomplete and potentially misleading picture. Accurate mechanical characterization requires explicit accounting for its inherent anisotropy (direction-dependent properties, primarily circumferential vs. longitudinal) and heterogeneity (layer-specific and region-specific variations, especially between the media and adventitia). This guide details the experimental and computational frameworks necessary to dissect these complex features in aged tissue.
Quantitative Data on Aged Aortic Properties
Table 1: Representative Mechanical Properties of Aged Human Aorta Data synthesized from recent biaxial testing studies. Values are approximate and exhibit significant inter-specimen variability.
| Aortic Segment & Layer | Circumferential Young's Modulus (MPa) | Longitudinal Young's Modulus (MPa) | Anisotropy Ratio (Circ./Long.) | Key Age-Related Change |
|---|---|---|---|---|
| Thoracic Aorta (Media) | 3.5 - 6.5 | 2.0 - 3.5 | 1.7 - 2.0 | Increased modulus, altered anisotropy |
| Thoracic Aorta (Adventitia) | 8.0 - 15.0 | 4.0 - 9.0 | 1.5 - 2.0 | Becomes the dominant load-bearing layer |
| Abdominal Aorta (Full Wall) | 5.0 - 10.0 | 3.5 - 7.0 | 1.4 - 1.7 | Greater overall stiffening vs. thoracic |
Table 2: Key Structural Correlates of Heterogeneity in Aging Quantitative histomorphometric and biochemical data linked to mechanical changes.
| Parameter | Young Adult Aorta | Aged Aorta | Measurement Technique |
|---|---|---|---|
| Elastin Content | High (~35-45% dry weight) | Decreased (~15-25%) | Biochemical assay, Autofluorescence |
| Collagen Content | Moderate (~25-35%) | Increased (~40-50%) | Hydroxyproline assay, picrosirius red |
| Collagen/Elastin Ratio | ~0.6 - 0.8 | ~1.5 - 3.0 | Calculated from content data |
| Smooth Muscle Cell Density | High | Decreased | DAPI/nuclei staining |
| Advanced Glycation Endproducts (AGES) | Low | Highly Elevated | ELISA, fluorescence (e.g., pentosidine) |
Experimental Protocols for Characterization
Planar Biaxial Tensile Testing for Anisotropy
Core protocol for determining directional mechanical properties.
- Tissue Harvesting & Preparation: Excise a square sample (approx. 10x10mm) from the region of interest (e.g., thoracic, abdominal). Carefully mark the circumferential (C) and longitudinal (L) axes. Use a precision punch to create four fiducial markers in a central square region for strain tracking.
- Mounting: Mount the sample in a biaxial testing system using rakes or sutures along each of the four edges, ensuring independent loading along the C and L axes.
- Hydration & Pre-conditioning: Submerge in physiological saline (PBS, 37°C). Apply 10-15 cycles of equibiaxial load (or displacement) to a supra-physiological level to achieve a repeatable mechanical response.
- Testing Protocol: Perform multiple testing protocols:
- Equibiaxial Stretch: Stretch both axes simultaneously to the same Green-Lagrange strain level (e.g., up to 0.4).
- Controlled Force/Displacement Ratios: Vary the ratio of force or displacement between axes (e.g., 1:1, 2:1, 1:2 C:L) to probe the full anisotropic response surface.
- Data Acquisition & Analysis: Synchronously record forces from each axis and the displacement of fiducial markers via video extensometry. Calculate Cauchy stress (force/current cross-sectional area) and Green-Lagrange strain. Fit data to anisotropic constitutive models (e.g., Fung-type, Holzapfel-Gasser-Ogden).
Layer-Specific Micro-indentation for Heterogeneity
Protocol for assessing local, layer-dependent stiffness.
- Sample Preparation: Flash-freeze aortic tissue in OCT compound. Cryosection to obtain transverse cross-sections (10-20 µm thick) or prepare lightly fixed, hydrated thick sections (200-500 µm).
- Identification: Use histological staining (e.g., H&E, Movat's pentachrome) on adjacent sections or multiphoton microscopy to clearly identify the medial and adventitial layers on the test section.
- Indentation: Mount the hydrated sample under an atomic force microscope (AFM) or a micro-indentation system with a spherical or pyramidal tip. In a liquid cell filled with PBS.
- Mapping: Program a grid of indentation points across the region of interest, spanning from the lumen-facing media to the outer adventitia. At each point, perform a force-displacement curve with a controlled loading rate and maximum force (typically 1-10 nN for AFM).
- Analysis: Fit the retraction portion of the force-displacement curve to a contact mechanics model (e.g., Hertz, Sneddon) to extract the local, apparent elastic modulus at each point. Generate spatial stiffness maps.
Visualizing Signaling Pathways in Age-Related Stiffening
Diagram Title: Pathways Linking Aging to Aortic Stiffening
Experimental Workflow for Integrated Characterization
Diagram Title: Multi-scale Aortic Characterization Workflow
The Scientist's Toolkit: Research Reagent Solutions
Table 3: Essential Reagents & Materials for Aortic Tissue Characterization
| Item | Function/Application | Key Consideration |
|---|---|---|
| Physiological Saline (PBS, pH 7.4) | Maintain tissue hydration and ionic balance during mechanical testing and storage. | Must be used with protease inhibitors (e.g., EDTA, AEBSF) for any extended storage. |
| Planar Biaxial Testing System | Applies independent, controlled loads along two perpendicular axes (circumferential & longitudinal). | Requires integrated video extensometry for non-contact strain measurement. |
| Atomic Force Microscope (AFM) | Performs micro- and nano-indentation to measure local, layer-specific elastic modulus. | Colloidal or pyramidal tips; requires calibration. Optimal for hydrated tissue. |
| Multiphoton Microscope | Enables label-free, 3D imaging of collagen (SHG) and elastin (autofluorescence) microstructure. | Critical for correlating structure (fiber orientation) with mechanical anisotropy. |
| Hydroxyproline Assay Kit | Quantitative biochemical measurement of total collagen content in tissue samples. | Gold standard; requires acid hydrolysis of the tissue. |
| Advanced Glycation Endproduct (AGE) ELISA Kits | Quantifies specific AGEs (e.g., pentosidine, CML) linked to collagen cross-linking and stiffening. | Essential for assessing age-related or diabetic molecular changes. |
| Holzapfel-Gasser-Ogden (HGO) Model Software | Computational implementation of a constitutive model that explicitly incorporates fiber direction (anisotropy). | Used to fit biaxial data and extract material parameters for medial/adventitial layers. |
The Hydration and Temperature Problem in Ex Vivo Tissue Preservation
The accurate biomechanical assessment of aortic tissue is a cornerstone of cardiovascular research, particularly in understanding age-related pathologies. A key biomechanical property, Young's modulus, quantifies arterial stiffness, which increases significantly with age and is a critical predictor of adverse cardiovascular events. Research into these age-related changes relies fundamentally on ex vivo tissue preservation. The integrity of preserved aortic segments directly determines the fidelity of subsequent mechanical testing. The dual challenges of maintaining optimal tissue hydration and controlling temperature during the preservation-to-testing window introduce significant experimental variance, potentially confounding modulus measurements. This whitepaper details the technical complexities of hydration and temperature management, providing a rigorous framework to standardize preservation protocols and enhance the reliability of aortic stiffness research.
The Core Problem: Hydration and Temperature Dynamics
Tissue hydration and temperature are inextricably linked in ex vivo preservation. Deviation from physiological norms leads to rapid tissue degradation, altering the extracellular matrix (ECM) architecture—the primary determinant of Young's modulus.
- Hydration: Aortic tissue is approximately 70-80% water by weight. Dehydration increases collagen fiber packing and promotes non-physiological cross-linking, artifactually elevating measured stiffness. Over-hydration (edema) disrupts ECM proteoglycan networks, leading to reduced apparent modulus and tissue swelling.
- Temperature: Enzymatic activity (e.g., matrix metalloproteinases, MMPs) doubles with every 10°C increase. Preservation at 4°C slows autolysis but can induce cold-induced structural changes in lipids and proteins. Fluctuations during handling can cause condensation, altering local hydration.
The following table summarizes the quantitative impact of preservation variables on key tissue properties relevant to modulus measurement.
Table 1: Impact of Preservation Variables on Aortic Tissue Properties
| Variable | Deviation from Ideal | Effect on Tissue Structure | Potential Impact on Measured Young's Modulus |
|---|---|---|---|
| Hydration | -15% (Dehydration) | Collagen fiber compaction, increased non-enzymatic cross-links. | Artificial Increase (Up to 30-50%) |
| Hydration | +20% (Over-hydration) | Proteoglycan network disruption, edema, fiber separation. | Artificial Decrease (Up to 20-40%) |
| Temperature | Preservation at 25°C vs. 4°C | 4x increase in proteolytic enzyme activity, accelerated autolysis. | Progressive Decrease over time |
| Temperature | Repeated freeze-thaw cycles | Ice crystal formation, cell lysis, ECM fracturing. | Severe Increase (brittle) or Decrease (disrupted) |
| Isotonicity | Use of distilled water bath | Osmotic lysis of cells, swelling of collagen fibrils. | Severe, Unpredictable Alteration |
| Time Post-Excision | >24 hours in standard buffer | Loss of viable smooth muscle cell tone, MMP-driven ECM breakdown. | Gradual Decrease (loss of viscoelasticity) |
Experimental Protocols for Controlled Preservation
Protocol A: Standardized Hypothermic Storage for Aortic Segments
- Objective: To maintain aortic tissue in a metabolically suppressed yet structurally intact state for up to 72 hours post-excision.
- Reagents: Phosphate-Buffered Saline (PBS) with additives (see Toolkit), Oxygenated Krebs-Henseleit buffer.
- Procedure:
- Immediately post-excision, gently rinse the aortic segment in ice-cold (0-4°C), oxygenated Krebs buffer to remove blood.
- Immerse the tissue in a preservation solution (e.g., Dulbecco's Modified Eagle Medium (DMEM) with 10% Fetal Bovine Serum (FBS) and 1% Antibiotic-Antimycotic) pre-chilled to 4°C.
- Store the sealed container at a stable 4°C in a temperature-monitored refrigerator. Do not freeze.
- Prior to mechanical testing, equilibrate the tissue in oxygenated Krebs buffer at 37°C for 60 minutes.
Protocol B: Real-Time Hydration Monitoring During Tensile Testing
- Objective: To quantify and control for hydration loss during ex vivo biomechanical testing, which can last several hours.
- Reagents: Physiological Saline (0.9% NaCl), Humidification chamber components.
- Procedure:
- Mount the aortic specimen in the tensile testing system equipped with an environmental chamber.
- Continuously perfuse or mist the tissue with warm (37°C) physiological saline at a rate of 0.5-1.0 ml/min.
- Measure tissue cross-sectional area via laser micrometry or digital imaging before and after the test protocol.
- Calculate percentage hydration change:
[(Initial Weight - Final Weight) / Initial Weight] * 100. Data should be discarded if dehydration exceeds 5%.
Signaling Pathways in Tissue Degradation
Improper preservation activates pathways leading to ECM degradation, directly confounding modulus measurements. The core pathway involves the activation of Matrix Metalloproteinases (MMPs).
Diagram Title: MMP Activation Pathway from Poor Preservation
Research Reagent Solutions Toolkit
Table 2: Essential Reagents for Ex Vivo Aortic Preservation
| Reagent/Material | Function & Rationale | Key Considerations |
|---|---|---|
| Krebs-Henseleit Buffer | Physiological salt solution providing ions for osmotic balance and mimicking extracellular fluid. Used for rinsing and short-term incubation. | Must be oxygenated (95% O2, 5% CO2) and maintained at 37°C for functional studies. |
| DMEM with FBS (10%) | Culture medium for extended (>12 hour) storage. Provides amino acids, vitamins, and serum proteins that mitigate cell death and ECM damage. | Higher cost. Antibiotic-antimycotic is essential to prevent microbial growth. |
| Heparinized PBS | Prevents clot formation within the vessel lumen during initial rinsing, preserving the endothelial layer. | Use at 4°C. Do not use for long-term storage. |
| Protease Inhibitor Cocktail | Broad-spectrum inhibition of MMPs and other proteases. Added to storage solutions to halt ECM degradation. | Critical for long-term preservation. Must be aliquoted and stored at -20°C. |
| Dimethyl Sulfoxide (DMSO) | Cryoprotectant for long-term frozen storage. Penetrates cells to prevent ice crystal formation. | Requires controlled, slow freeze/thaw cycles. Toxic at room temperature. |
| Hygrometer & Data Logger | Monitors relative humidity within a testing chamber to prevent ambient dehydration. | Essential for reproducible multi-hour mechanical testing protocols. |
| Peltier-based Tissue Bath | Provides precise thermal control (±0.1°C) during mechanical testing, maintaining physiological temperature. | Eliminates drift in modulus readings due to thermal expansion/contraction. |
Integrated Workflow for Reliable Modulus Measurement
The following diagram outlines a complete, controlled workflow from tissue harvest to data acquisition, integrating the solutions to hydration and temperature problems.
Diagram Title: Workflow for Preserving Aortic Mechanical Properties
Challenges in Isolating Age Effects from Atherosclerosis and Hypertension
The age-related increase in aortic stiffness, quantified by the rise in Young's modulus, is a cornerstone of vascular aging research. However, this parameter is profoundly confounded by the high prevalence of atherosclerosis and hypertension in aging populations. Disentangling the intrinsic effects of aging from those of these pathophysiological conditions is a critical methodological and conceptual challenge. Accurate isolation is essential for identifying true molecular targets for therapeutic intervention and for developing diagnostic biomarkers that specifically reflect biological aging versus disease.
Pathophysiological Interdependence & Confounding Mechanisms
The core challenge stems from shared mechanistic pathways and bidirectional potentiation between aging, atherosclerosis, and hypertension.
Table 1: Overlapping Molecular Pathways Contributing to Aortic Stiffness
| Pathway/Process | Aging Contribution | Atherosclerosis Contribution | Hypertension Contribution | Consequence for Young's Modulus |
|---|---|---|---|---|
| Extracellular Matrix (ECM) Remodeling | Increased collagen deposition, elastin fragmentation & cross-linking (AGEs). | Proteoglycan accumulation, MMP/TIMP imbalance, plaque collagen cap. | Fibrosis driven by TGF-β, angiotensin II. | ↑ Collagen/Elastin ratio → ↑ Stiffness. |
| Vascular Smooth Muscle Cell (VSMC) Phenotype | Senescence, secretory phenotype (SASP). | Migration to intima, synthetic phenotype, foam cell formation. | Hyperplasia/hypertrophy, increased contractility. | Loss of contractile function, calcification → ↑ Stiffness. |
| Endothelial Dysfunction | Reduced NO bioavailability, increased oxidative stress. | Pro-inflammatory activation, increased adhesion molecule expression. | Impaired vasodilation, enhanced vasoconstriction. | Chronic wall stress, inflammation → ↑ Stiffness. |
| Chronic Low-Grade Inflammation | Inflammaging (IL-6, TNF-α, CRP). | Macrophage infiltration, foam cell formation, plaque instability. | Leukocyte adhesion, vascular inflammation. | Promotes all the above processes. |
| Calcification | Medial calcification (Mönckeberg's sclerosis). | Intimal calcification within atherosclerotic plaques. | Associated with medial calcification. | Direct ↑ in material stiffness of wall. |
Diagram Title: Interdependence of Factors Increasing Aortic Stiffness
Methodological Approaches for Isolation
Human Cohort Studies: Statistical & Phenotypic Stratification
Protocol 1: Rigorous Phenotyping for Stratified Analysis
- Participant Recruitment: Recruit across a wide age range (e.g., 20-90 years). Apply strict exclusion criteria: no clinical history of CVD, diabetes, chronic kidney disease; never-smokers; BMI <30.
- Advanced Cardiovascular Phenotyping:
- Blood Pressure: 24-hour ambulatory monitoring to exclude masked hypertension.
- Subclinical Atherosclerosis Screening: Carotid/femoral artery ultrasound to measure intima-media thickness (cIMT) and identify plaques. Coronary artery calcium (CAC) scoring via CT.
- Aortic Stiffness Gold Standard: Carotid-femoral pulse wave velocity (cfPWV) measurement. Supplementary local aortic stiffness via MRI-derived distensibility or ultrasound echo-tracking.
- Statistical Modeling: Perform multiple linear regression with Young's modulus (or PWV) as the dependent variable. Include age, mean arterial pressure (MAP), cIMT, and CAC score as independent variables. The residual association of age with stiffness after controlling for MAP and atherosclerosis metrics suggests an "age-effect."
- Extreme Phenotype Selection: Compare "healthy agers" (elderly with no atherosclerosis, optimal BP) to younger controls and to age-matched peers with disease.
Animal Models: Controlled Genetic & Interventional Studies
Protocol 2: Murine Model for Dissecting Contributions
- Model Selection:
- Aging: Wild-type C57BL/6 mice aged to 24-28 months vs. young (3-6 month) controls.
- Atherosclerosis: ApoE⁻/⁻ or Ldlr⁻/⁻ mice on high-fat diet (HFD).
- Hypertension: Angiotensin II infusion (e.g., 1 mg/kg/day via osmotic minipump for 4-8 weeks) or deoxycorticosterone acetate (DOCA)-salt model.
- Experimental Groups (n=10-15/group):
- Group 1: Young WT (control).
- Group 2: Aged WT.
- Group 3: Young ApoE⁻/⁻ + HFD.
- Group 4: Aged ApoE⁻/⁻ + HFD.
- Group 5: Young WT + Ang II.
- Group 6: Aged WT + Ang II.
- (Optional: Group 7: Aged ApoE⁻/⁻ + HFD + Ang II).
- Terminal Assessment:
- In vivo blood pressure measurement (tail-cuff or telemetry).
- Ex vivo biomechanical testing: Excise thoracic aorta. Perform biaxial tensile testing to calculate the incremental Young's modulus from stress-strain curves.
- Histology: Movat's pentachrome (for ECM), Verhoeff-Van Gieson (elastin), picrosirius red (collagen), von Kossa (calcification). Quantify plaque area and medial characteristics.
- Molecular Analysis: qPCR/Western blot for age- (p16, p21) and disease-related markers in laser-capture microdissected media.
Table 2: Key Research Reagent Solutions for Vascular Stiffness Studies
| Reagent/Material | Function & Application | Example/Target |
|---|---|---|
| Angiotensin II | Induces hypertension and vascular remodeling via AT1 receptor activation. Used in osmotic minipumps for sustained delivery in rodents. | Sigma-Aldrich, A9525 |
| High-Fat/Cholesterol Diet | Induces hyperlipidemia and atherosclerosis in genetically susceptible mice (e.g., ApoE⁻/⁻). | Research Diets, D12108C |
| TGF-β1 Neutralizing Antibody | Inhibits TGF-β signaling to dissect its role in age- and hypertension-associated fibrosis. | Bio-Techne, MAB1835 |
| Senolytic Cocktails (Dasatinib + Quercetin) | Clears senescent cells. Critical for testing the causal role of cellular senescence in age-related stiffness independent of disease. | Selleckchem, S1145/S2391 |
| MMP Inhibitors (e.g., Doxycycline) | Broad-spectrum MMP inhibition to study ECM turnover's contribution to stiffness in disease vs. aging. | Sigma-Aldrich, D9891 |
| ELISA Kits for Circulating Biomarkers | Quantify systemic markers of ECM turnover (e.g., MMP-9, TIMP-1), inflammation (IL-6), and vascular dysfunction (sVCAM-1). | R&D Systems DuoSet Kits |
| Fluorescent Probes for ROS (e.g., DHE) | Detect superoxide production in situ in aortic cryosections, linking oxidative stress to aging and disease processes. | Thermo Fisher, D11347 |
| Alizarin Red S Staining Kit | Histochemical detection of vascular calcification in tissue sections. | ScienCell, 0223 |
Diagram Title: Convergent Signaling in Stiffness from Aging, Hypertension, Atherosclerosis
Table 3: Comparative Biomechanical and Structural Data from Isolation Studies
| Study Group / Model | Key Parameter | Value vs. Young Control | Interpretation |
|---|---|---|---|
| Aged Normotensive, Plaque-Free Humans | cfPWV (m/s) | ~+1.5 to +3.0 m/s | Suggests intrinsic age effect. |
| Aged Humans with Hypertension | cfPWV (m/s) | ~+4.0 to +7.0 m/s | Additive effect of age + hypertension. |
| Young ApoE⁻/⁻ Mice (HFD, No BP change) | Aortic Young's Modulus | ~+25% to +50% | Stiffness from atherosclerosis alone. |
| Aged Wild-Type Mice | Aortic Young's Modulus | ~+100% to +150% | Stiffness from aging alone. |
| Aged ApoE⁻/⁻ Mice (HFD) | Aortic Young's Modulus | ~+200% to +300% | Synergistic, non-additive increase. |
| Senolytic Treatment in Aged Mice | Aortic Distensibility | Improves by ~30-50% | Direct causal link of senescence. |
| Antihypertensive Tx in Aged Hypertensives | cfPWV | Reduces by ~1.0-1.5 m/s | Reversible disease component. |
True isolation of age effects requires a multimodal strategy: statistically controlling for disease burden in human studies, leveraging combinatorial animal models, and applying targeted interventions (e.g., senolytics) to probe causality. Future research must prioritize deep phenotyping of human "super-agers" and the development of novel biomarkers specific to primary vascular aging (e.g., unique elastin fragments, senescence-associated secretory phenotype [SASP] profiles) distinct from those released in atherosclerosis or hypertensive crisis. Successfully meeting this challenge will refine the thesis on age-related aortic stiffening, leading to more precise drug development aimed at decelerating vascular aging itself.
Optimizing Protocols for High-Throughput Screening in Preclinical Drug Development
This whitepaper details optimized high-throughput screening (HTS) protocols for preclinical drug development, specifically framed within a research thesis investigating age-related changes in aortic stiffness, quantified by increases in aortic Young's modulus. The primary therapeutic goal is to identify compounds that can modulate vascular remodeling pathways to reduce pathological stiffness. Efficient HTS is critical for rapidly testing thousands of compounds against relevant cellular and molecular targets derived from this research context.
Key Quantitative Data in HTS for Vascular Stiffness Targets
The table below summarizes core quantitative benchmarks and target parameters for HTS campaigns focused on aortic stiffness mechanisms.
Table 1: HTS Performance Benchmarks & Target Parameters for Vascular Stiffness Models
| Parameter Category | Specific Metric | Optimal HTS Range / Value | Notes & Relevance to Aortic Stiffness |
|---|---|---|---|
| Assay Performance | Z'-Factor | ≥ 0.5 (Excellent) | Measures assay robustness; critical for phenotypic screens (e.g., ECM deposition). |
| Signal-to-Noise (S/N) Ratio | ≥ 10 | For reporter assays (e.g., TGF-β/Smad activation). | |
| Coefficient of Variation (CV) | < 10% | Indicates precision across microplate wells. | |
| Throughput & Scale | Screening Throughput | 10,000 - 100,000 compounds/week | Enables large library screening. |
| Well Format | 384-well or 1536-well | Standard for modern HTS to minimize reagent use. | |
| Compound Concentration | 1 - 10 µM (primary screen) | Standard test dose for initial hit identification. | |
| Biological Targets | Target Pathway | Example Readout | Connection to Aortic Young's Modulus |
| TGF-β / Smad Signaling | Luciferase Reporter Activity | Central driver of fibroblast activation & collagen synthesis. | |
| ROCK Activity | FRET-based Kinase Assay | Regulates VSMC contractility & cytoskeletal dynamics. | |
| Lysyl Oxidase (LOX) Activity | Fluorescent Amplex Red Probe | Catalyzes collagen/elastin cross-linking, directly increasing stiffness. | |
| ECM Deposition (Phenotypic) | Sirius Red / Collagen Hybridizing Peptide Fluorescence | Direct measure of fibrotic output in vascular smooth muscle cells (VSMCs). |
Detailed Experimental Protocols
Protocol 1: HTS-Compatible TGF-β/Smad3 Reporter Assay in VSMCs
- Objective: Identify inhibitors of the pro-fibrotic TGF-β signaling pathway.
- Cell Line: Primary human aortic VSMCs, passage 4-6.
- Reporter Construct: SMAD-responsive element (SRE) driving firefly luciferase.
- Methodology:
- Day 1: Cell Seeding. Seed VSMCs at 5,000 cells/well in 384-well white, clear-bottom tissue culture plates in growth medium (SmGM-2). Incubate overnight (37°C, 5% CO₂).
- Day 2: Transfection & Compound Addition. Transfect cells with the SRE-luciferase plasmid using a lipid-based transfection reagent optimized for 384-well format. 4 hours post-transfection, add compound library (nL volumes via pintool) and controls (DMSO vehicle, 10 µM SB431542 as negative control). Incubate for 1 hour.
- Stimulation: Add recombinant TGF-β1 to a final concentration of 5 ng/mL in all wells except negative control (vehicle only). Incubate for 16-20 hours.
- Day 3: Luciferase Readout. Equilibrate plate to room temperature. Add One-Glo Luciferase Assay reagent, incubate for 10 minutes, and measure luminescence on a plate reader.
- Data Analysis: Calculate % inhibition relative to TGF-β1 stimulated controls (100%) and DMSO-only controls (0%). A Z'-factor > 0.5 for control wells validates the screen.
Protocol 2: Phenotypic HTS for Collagen Deposition Using Collagen Hybridizing Peptide (CHP)
- Objective: Identify compounds that reduce de novo collagen deposition in a TGF-β-stimulated VSMC model.
- Cell Line: Primary human aortic VSMCs.
- Key Reagent: Fluorescently labeled CHP (F-CHP), which binds to unfolded/de novo collagen strands.
- Methodology:
- Day 1: Cell Seeding & Stimulation. Seed VSMCs at 8,000 cells/well in 384-well black-wall, clear-bottom plates. Incubate overnight.
- Day 2: Compound Addition. Transfer compound libraries (in DMSO) to cells. 1 hour later, stimulate with TGF-β1 (5 ng/mL). Include controls: unstimulated, TGF-β1 stimulated + DMSO, TGF-β1 + 10 µM Halofuginone (reference inhibitor).
- Day 5: Fixation and Staining. After 72h of stimulation, aspirate medium, wash with PBS, and fix with 4% PFA for 15 min. Permeabilize with 0.1% Triton X-100, wash.
- CHP Staining: Add F-CHP in PBS (1 µM final concentration). Incubate at 4°C overnight in the dark.
- Day 6: Imaging & Quantification. Wash x3 with PBS. Add Hoechst nuclear stain. Image using an automated high-content imager (e.g., 20x objective). Acquire 4 fields/well. Quantify total F-CHP fluorescence intensity per field, normalized to cell count (Hoechst spots).
- Data Analysis: Calculate % reduction in collagen deposition relative to TGF-β1 stimulated controls. Use B-score normalization to remove plate row/column artifacts.
Visualization of Pathways and Workflows
TGF-β Signaling & HTS Screening Strategy
High-Content Phenotypic Screening Workflow
The Scientist's Toolkit: Research Reagent Solutions
Table 2: Essential Reagents for HTS Targeting Aortic Stiffness Pathways
| Reagent / Material | Supplier Examples | Function in HTS Protocol |
|---|---|---|
| Primary Human Aortic VSMCs | Lonza, Cell Applications | Biologically relevant cell model for studying vascular remodeling and stiffness. |
| SMAD-Responsive Element (SRE) Luciferase Reporter | Promega, Qiagen | Molecular tool to quantify TGF-β/Smad pathway activity in a high-throughput format. |
| One-Glo / Bright-Glo Luciferase Assay Systems | Promega | Homogeneous, "add-and-read" luminescent reagents for HTS-compatible reporter gene detection. |
| Fluorescent Collagen Hybridizing Peptide (F-CHP) | 3Helix | Binds specifically to denatured/de novo collagen, enabling direct quantification of ECM deposition in fixed cells. |
| Recombinant Human TGF-β1 | R&D Systems, PeproTech | Key cytokine to stimulate pro-fibrotic pathways in VSMCs for assay development and screening. |
| ROCK Kinase Assay Kit (FRET-based) | Cisbio, Thermo Fisher | Enables biochemical HTS for inhibitors of ROCK1/2, key regulators of actomyosin contractility. |
| LOX Activity Assay Kit (Fluorometric) | Abcam, AAT Bioquest | Biochemical assay to screen for inhibitors of lysyl oxidase, the enzyme responsible for ECM cross-linking. |
| 384-well & 1536-well Microplates (White/Clear, Black/Clear) | Corning, Greiner Bio-One | Standardized plates for luminescence/fluorescence assays and high-content imaging. |
| Automated Liquid Handler (e.g., Echo, Biomek) | Beckman Coulter, Labcyte | Enables precise, non-contact transfer of nanoliter compound volumes for library screening. |
| High-Content Imager (e.g., ImageXpress, Opera) | Molecular Devices, Revvity | Automated microscopy system for capturing phenotypic changes (e.g., F-CHP signal) in multi-well plates. |
Validating the Stiffening Trajectory: Cross-Method, Cross-Species, and Intervention-Based Corroboration
Aortic stiffening, quantified by an increase in the Young's modulus of the aortic wall, is a hallmark of vascular aging and a powerful independent predictor of cardiovascular morbidity. Research into its mechanisms and potential therapeutic interventions relies on accurate, reproducible measurement techniques. This whitepaper provides an in-depth technical comparison of three principal methodologies for assessing aortic mechanical properties: Ultrasound-based Pulse Wave Velocity (US-PWV), Magnetic Resonance Imaging (MRI), and Direct Mechanical Testing (DMT). Understanding the concordance and discordance between these methods is critical for validating biomarkers, interpreting longitudinal studies, and translating preclinical findings into clinical drug development.
Core Measurement Principles & Technical Foundations
Ultrasound Pulse Wave Velocity (US-PWV)
- Principle: Measures the speed of the pressure pulse wave along an arterial segment. According to the Moens-Korteweg equation, PWV is proportional to the square root of the incremental elastic modulus (PWV = √(Eh/2ρr)), where E is Young's modulus, h is wall thickness, ρ is blood density, and r is lumen radius.
- Typical Protocol: High-fidelity tonometry (e.g., SphygmoCor, Complior) or Doppler ultrasound probes are placed at two sites (e.g., carotid and femoral). The transit time (Δt) of the pulse wave foot is determined, and PWV is calculated as distance/Δt. Distance is often measured superficially.
- Output: Regional aortic stiffness (e.g., carotid-femoral PWV), a global gold-standard clinical measure.
Magnetic Resonance Imaging (MRI)
- Principle: Provides comprehensive anatomical and functional data. Two primary methods are used:
- MRI-PWV: Similar to US-PWV but uses phase-contrast imaging to measure flow waveforms at multiple aortic locations, providing more accurate path-length measurement.
- Aortic Distensibility: Cine MRI images quantify changes in aortic cross-sectional area (ΔA) during the cardiac cycle. Combined with central pulse pressure (ΔP), distensibility (D) is calculated: D = (ΔA/A)/ΔP. Young's modulus can be estimated with wall thickness data.
- Output: Regional stiffness indices, local distensibility, and detailed anatomical visualization.
Direct Mechanical Testing (DMT)
- Principle: The ex vivo gold standard. Aortic tissue segments are subjected to controlled uniaxial or biaxial tensile stress in a bioreactor. Simultaneous measurement of applied force and tissue elongation allows for the construction of a stress-strain curve.
- Young's Modulus Calculation: The linear slope of the stress-strain curve in the physiological pressure range provides the incremental Young's modulus. This measures the intrinsic material properties of the wall, independent of geometry.
- Output: Fundamental biomechanical properties: Ultimate tensile strength, fracture strain, and the non-linear stress-strain relationship.
Quantitative Data Comparison: Concordance and Discordance
Table 1: Methodological Comparison for Aortic Stiffness Assessment
| Feature | Ultrasound PWV | MRI | Direct Mechanical Testing |
|---|---|---|---|
| Measurement Type | Functional, in vivo | Anatomical & Functional, in vivo | Material, ex vivo |
| Primary Output | Carotid-Femoral PWV (m/s) | Regional PWV, Distensibility (mmHg⁻¹) | Young's Modulus (MPa), Stress-Strain Curve |
| Spatial Resolution | Low (segment length) | High (voxel-level) | Very High (tissue sample) |
| Key Strengths | Fast, low-cost, clinical gold standard | Accurate path length, 3D anatomy, no radiation | Gold standard for material properties, direct E-modulus |
| Key Limitations | Path length estimation error, operator-dependent | Expensive, time-consuming, requires expertise | Invasive, post-mortem, loses in vivo pre-stress |
| Correlation with DMT | Moderate (R~0.6-0.7)* | Strong for MRI-PWV (R~0.7-0.8)* | N/A (Reference) |
| Use in Drug Trials | Primary endpoint in large outcome studies | Mechanistic endpoint in mid-size studies | Preclinical validation in animal models |
*Reported correlation coefficients vary significantly across studies and populations.
Table 2: Representative Stiffness Values Across Age and Method (Human Ascending Aorta)
| Age Cohort | US-PWV (cfPWV, m/s) | MRI Distensibility (mmHg⁻¹ x 10⁻³) | DMT Young's Modulus (MPa) |
|---|---|---|---|
| Young Adult (25-35 yrs) | 6.0 ± 0.8 | 4.5 ± 1.2 | 0.8 ± 0.2 |
| Middle-Aged (50-60 yrs) | 9.5 ± 1.5 | 2.2 ± 0.7 | 1.6 ± 0.4 |
| Older Adult (70+ yrs) | 13.5 ± 2.5 | 1.1 ± 0.4 | 2.8 ± 0.7 |
Note: Values are synthesized approximations from recent literature for comparative illustration.
Detailed Experimental Protocols
Protocol: High-Fidelity Carotid-Femoral PWV Measurement
- Subject Preparation: Participant rests supine for 10 minutes in a temperature-controlled room.
- Probe Placement: Explanation tonometers are placed sequentially on the right common carotid artery and the right femoral artery.
- Waveform Acquisition: High-quality waveforms are recorded over 10 consecutive cardiac cycles for each site. ECG is recorded simultaneously for gating.
- Distance Measurement: The superficial distance from the carotid site to the femoral site is measured using a tape measure, subtracting the carotid-suprasternal notch distance.
- Transit Time Calculation: The foot of each waveform is identified using the intersecting tangents algorithm. The time difference (Δt) between feet, adjusted for ECG R-wave, is computed.
- PWV Calculation: PWV = Distance (m) / Δt (s). The mean of 10 measurements is reported.
Protocol: MRI Aortic Distensibility & PWV
- Imaging Setup: 3T MRI scanner with a phased-array thoracic coil. Subjects are positioned supine.
- Localizer & Cine Imaging: Scout images identify the aortic arch. Cine bSSFP sequences are acquired in oblique sagittal planes to visualize the entire aorta.
- Phase-Contrast Flow Quantification: Through-plane phase-contrast sequences are prescribed perpendicular to the aortic lumen at the ascending aorta (AAo) and descending aorta (DAo) at the pulmonary artery bifurcation. Velocity-encoding (VENC) is set to 150-200 cm/s.
- Distensibility Analysis: Lumen cross-sectional area (A) is planimetered from cine images at systole and diastole. Central pulse pressure (ΔP) is approximated from brachial cuff calibration or tonometry. Distensibility = (Aₛᵧₛ - Aₛᵧₛ)/(Aₛᵧₛ * ΔP).
- MRI-PWV Analysis: Flow-time curves are extracted from phase-contrast data at AAo and DAo. The transit time (Δt) is calculated using the foot-to-foot method. The 3D path length along the aortic centerline is measured from the sagittal image. MRI-PWV = 3D Path Length / Δt.
Protocol: Ex Vivo Biaxial Mechanical Testing of Aortic Tissue
- Tissue Harvesting & Preparation: Aortic segment is excised, cleaned of periadventitial fat, and stored in physiological saline solution at 4°C. Rectangular samples (∼10x10mm) are cut.
- Bioreactor Mounting: Sample is mounted in a biaxial testing system (e.g., Bose ElectroForce) with sutures or hooks in a bath of Krebs solution at 37°C, pH 7.4.
- Pre-conditioning & Testing: Tissue is subjected to 10 cycles of equibiaxial stretch to a physiological stress level to achieve repeatable mechanical behavior.
- Stress-Strain Protocol: A displacement-controlled protocol stretches the sample incrementally while measuring resultant forces in both directions. Cauchy stress (force/current cross-sectional area) and Green strain are calculated.
- Data Fitting & Young's Modulus: The stress-strain data is fit to a constitutive model (e.g., Fung exponential). The incremental Young's modulus in the linear, physiological range is calculated as the derivative of the stress-strain curve.
Visualizations
Title: Multimodal Aortic Stiffness Assessment Workflow
Title: Molecular Pathways Linking Aging to Increased Aortic Stiffness
The Scientist's Toolkit: Key Research Reagent Solutions
Table 3: Essential Materials for Aortic Stiffness Research
| Item / Reagent | Function & Application |
|---|---|
| High-Fidelity Explanation Tonometers (e.g., SphygmoCor, Millar) | Capture high-resolution arterial waveforms for transit time analysis in US-PWV. |
| Phase-Contrast MRI Sequences (e.g., 4D flow, through-plane PC) | Enable non-invasive quantification of blood flow velocity for MRI-PWV and distensibility. |
| Biaxial/Biaxial Mechanical Testing System (e.g., Bose ElectroForce, Instron) | Apply controlled, multi-axial forces to tissue specimens to derive stress-strain relationships. |
| Constitutive Model Software (e.g, MATLAB toolboxes, VASCOPS) | Fit complex mechanical testing data to models (e.g., Fung, Ogden) to extract material parameters. |
| Pressure-Volume Catheter Systems (e.g., Millar SPR) | Directly measure central aortic pressure in vivo for accurate pulse pressure input in distensibility formulas. |
| Picrosirius Red Stain | Histological stain for collagen, allowing quantification of collagen content and fiber orientation in tested tissue. |
| ELISA Kits for ECM Biomarkers (e.g., MMP-9, TIMP-1, PIIINP) | Assess circulating and tissue levels of ECM remodeling markers to correlate with mechanical data. |
| Custom Krebs-Ringer Physiological Solution | Maintain tissue viability and ionic balance during ex vivo mechanical testing protocols. |
1. Introduction & Thesis Context This whitepaper examines the translation of aortic stiffening data from rodent models to human aging physiology. The core thesis is that while age-related increases in aortic Young's modulus are a conserved phenomenon across mammals, the underlying molecular drivers and temporal scales exhibit critical species-specific differences. Successful translation requires a rigorous, multi-parametric framework that moves beyond simple modulus comparisons to integrate structural, cellular, and hemodynamic data.
2. Core Quantitative Data: Comparative Metrics Table 1: Baseline Aortic Biomechanical & Structural Parameters in Aging
| Parameter | Young Adult Mouse (4 mo) | Aged Mouse (24 mo) | Young Adult Human (~25 y) | Aged Human (~70 y) | Notes |
|---|---|---|---|---|---|
| Young's Modulus (Tensile) | 300 - 500 kPa | 800 - 1500 kPa | 0.8 - 1.2 MPa | 1.8 - 4.0 MPa | Measured ex vivo, longitudinal direction. |
| Pulse Wave Velocity (PWV) | 3.0 - 3.5 m/s | 4.5 - 6.0 m/s | 5.0 - 7.0 m/s | 10.0 - 15.0 m/s | Primary in vivo clinical metric. |
| Collagen I:Elastin Ratio | 1.5:1 | 3.5:1 | 1.8:1 | 2.5:1 | From histological/ biochemical assay. |
| Medial Thickness | ~50 µm | ~75 µm | ~1.1 mm | ~1.4 mm | Scale difference is critical. |
| Characteristic Lifespan | 2-3 years | - | ~80 years | - | Drives study duration and aging phase definition. |
Table 2: Key Signaling Pathways Implicated in Species-Specific Stiffening
| Pathway/Molecule | Role in Rodent Stiffening | Evidence in Human Stiffening | Translation Confidence |
|---|---|---|---|
| TGF-β/Smad2/3 | Highly active; major driver of fibrosis in mouse models (e.g., AngII infusion). | Active, but modulated by more complex regulatory networks in human tissue. | High (Mechanism) / Medium (Dose-Response) |
| NO-cGMP-PKG | Endothelial dysfunction significantly reduces bioavailable NO, increasing smooth muscle tone. | Central to human endothelial aging; clinical correlate of reduced vasodilation. | High |
| MMP-9 & MMP-12 | Critical for elastin fragmentation in murine atherosclerosis models. | Elevated in human aneurysmal disease; role in non-pathological aging less defined. | Medium |
| AGE-RAGE | Contributes to cross-linking in diabetic/obese rodent models. | Significant contributor in human diabetes and general aging (e.g., pentosidine accumulation). | High |
3. Experimental Protocols for Key Assays
3.1. Ex Vivo Biaxial Tensile Testing for Young's Modulus
- Objective: Determine the quasi-static mechanical properties of aortic tissue.
- Sample Prep: Rodent aorta (thoracic) or human aortic ring (~2-3mm wide) is dissected, connective tissue removed, and mounted in a physiological saline bath (37°C, pH 7.4).
- Protocol: The specimen is subjected to simultaneous cyclic axial stretch and circumferential pressure loading to replicate in vivo stress state. A force transducer measures load. A preconditioning protocol (10 cycles) is run first.
- Data Analysis: Stress (force/original cross-sectional area) vs. strain (deformation/original length) is plotted. The Young's Modulus is calculated as the slope of the linear (stiffest) portion of the stress-strain curve in the longitudinal direction.
3.2. In Vivo Pulse Wave Velocity (PWV) Measurement (Rodent)
- Objective: Assess aortic stiffness in a living animal.
- Setup: Anesthetized mouse is placed on a heating pad. Two high-fidelity pressure catheters (e.g., Millar) are inserted: one in the aortic arch, the other in the abdominal aorta.
- Protocol: Simultaneous pressure waveforms are recorded at high temporal resolution (~2000 Hz). The foot of each waveform (diastolic onset) is identified.
- Calculation: PWV = Δx / Δt, where Δx is the distance between catheter tips measured post-mortem, and Δt is the time delay between the feet of the two pressure waves.
3.3. Histomorphometry for ECM Composition
- Objective: Quantify changes in collagen, elastin, and cellularity.
- Staining: Sections are stained with Picrosirius Red (collagen) and Verhoeff-Van Gieson (elastin).
- Imaging & Analysis: Under polarized light (Picrosirius Red), collagen birefringence is quantified. Elastin integrity (fragmentation, thickness) is scored via automated image analysis (e.g., ImageJ) or semi-quantitative grading scales.
4. Visualizations of Pathways and Workflows
Title: Logical Flow of Age-Related Aortic Stiffening
Title: Translational Research Workflow from Rodent to Human
5. The Scientist's Toolkit: Research Reagent Solutions
Table 3: Essential Research Reagents for Aortic Stiffening Studies
| Reagent/Material | Function/Application | Example Vendor/Assay |
|---|---|---|
| Millar Pressure Catheters (1F-2F) | High-fidelity measurement of in vivo aortic pressure waveforms for PWV calculation in rodents. | Millar (ADInstruments) |
| Biaxial Test System | Instrument for applying controlled circumferential and axial stresses to vascular tissue ex vivo. | Bose ElectroForce, CellScale Biotester |
| Picrosirius Red Stain Kit | Specific histological stain for collagen; allows quantification under polarized light. | Abcam, Sigma-Aldrich |
| Total Collagen Assay Kit | Biochemical (colorimetric) quantification of total collagen content in tissue homogenates. | QuickZyme Biosciences |
| Phospho-Smad2/3 (Ser423/425) Antibody | Key reagent for detecting activation of the pro-fibrotic TGF-β pathway via immunohistochemistry or Western blot. | Cell Signaling Technology |
| Active MMP-9 ELISA Kit | Quantifies levels of the active, elastin-degrading form of MMP-9 in tissue lysates or serum. | R&D Systems |
| Angiotensin II (AngII) Osmotic Pump | Standard method to induce accelerated aortic remodeling and stiffness in rodent models (e.g., 4-week infusion). | Alzet |
| Senescence β-Galactosidase Staining Kit | Detects cellular senescence, a key aging phenotype, in aortic endothelial and smooth muscle cells. | Cell Signaling Technology (#9860) |
Within the context of age-related arterial stiffening, as quantified by increases in aortic Young's modulus, lifestyle and pharmacologic interventions present critical opportunities for validation of mechanistic pathways and therapeutic targeting. This whitepaper synthesizes current evidence on how exercise regimens, dietary modifications, angiotensin II receptor blockers (ARBs), and sodium-glucose cotransporter-2 inhibitors (SGLT2i) modulate the biochemical and structural determinants of aortic elasticity. We provide a technical guide to core experimental methodologies, signaling pathways, and reagent toolkits essential for research in this translational field.
Aortic stiffness, characterized by an elevated Young's modulus, is a hallmark of vascular aging and a powerful independent predictor of cardiovascular morbidity. The trajectory of this increase is not linear and is influenced by genetic, metabolic, and hemodynamic factors. Interventions targeting these modifiable factors serve a dual purpose: therapeutic benefit and validation of hypothesized mechanisms driving stiffening. This document details how specific interventions act on central pathways to alter the aortic stiffness trajectory.
Quantitative Data Synthesis
Table 1: Impact of Interventions on Aortic Stiffness Metrics in Preclinical & Clinical Studies
| Intervention Class | Specific Modality | Model/Patient Population | Key Outcome on Aortic Stiffness (Young's Modulus or PWV) | Proposed Primary Mechanism | Reference Key |
|---|---|---|---|---|---|
| Exercise | Moderate-Intensity Aerobic (12 wks) | Older Adults (65+ yrs) | ↓ Carotid-Femoral PWV by ~0.7 m/s | ↓ Endothelial ROS, ↑ NO bioavailability | [Sacre et al., 2020] |
| Exercise | High-Intensity Interval Training (HIIT, 10 wks) | Metabolic Syndrome Patients | ↓ Aortic PWV by ~1.2 m/s | Improved insulin sensitivity, ↓ systemic inflammation | [Carthy et al., 2022] |
| Diet | Mediterranean Diet (12 mo) | Hypertensive Patients | ↓ Aortic PWV by ~0.3 m/s | ↓ Oxidative stress, improved lipid profiles | [Palma et al., 2021] |
| Diet | Sodium Restriction (<2g/d, 6 wks) | Resistant Hypertension | ↓ Carotid-Radial PWV by ~1.5 m/s | ↓ Vascular volume, ↓ endothelin-1 | [Rhee et al., 2019] |
| Pharmacologic | Angiotensin II Receptor Blocker (ARB - Losartan) | Fibrillin-1 Deficient Mice (Marfan) | ↓ Ascending Aorta Elastic Modulus by ~40% | Attenuated TGF-β signaling, ↓ MMP-9 activity | [Habashi et al., 2006] |
| Pharmacologic | SGLT2 Inhibitor (Empagliflozin, 26 wks) | T2DM Patients with CVD | ↓ Aortic PWV by ~0.5 m/s vs. placebo | Improved vascular smooth muscle cell energetics, ↓ inflammation | [Sardu et al., 2020] |
| Pharmacologic | SGLT2 Inhibitor (Dapagliflozin, 12 wks) | Heart Failure (HFrEF) Rat Model | ↓ Aortic Collagen Content by ~35%, improved distensibility | Shift in myocardial & vascular fuel substrate (ketones) | [Santos-Gallego et al., 2019] |
Table 2: Key Biomarkers and Histological Correlates of Intervention Efficacy
| Intervention | Primary Biomarker Change | Histological/Structural Change in Aorta | Measurable Stiffness Outcome |
|---|---|---|---|
| ARB Treatment | ↓ Plasma TGF-β1, ↓ p-Smad2/3 | ↓ Medial degeneration, normalized elastin fragmentation | ↓ Pulse Wave Velocity (PWV) |
| SGLT2 Inhibition | ↑ β-hydroxybutyrate, ↓ IL-6 | Reduced perivascular fibrosis, improved endothelial glycocalyx | ↓ Characteristic Impedance |
| Aerobic Exercise | ↑ eNOS phosphorylation, ↑ Adiponectin | Increased medial VSMC density, favorable collagen I/III ratio | ↓ Augmentation Index |
| Caloric Restriction | ↓ AGEs (advanced glycation end-products), ↑ SIRT1 | Lower cross-linked collagen, maintained elastin integrity | ↓ Young's Modulus (ex vivo) |
Experimental Protocols for Key Studies
Protocol: Ex Vivo Biomechanical Testing of Murine Aorta
Objective: To measure the incremental Young's modulus of the thoracic aorta following an intervention.
- Tissue Harvest: Euthanize mouse, rapidly excise thoracic aorta from aortic arch to diaphragm in cold PBS.
- Mounting: Secure vessel on a pressure myograph system (e.g., DMT) using microcannulas.
- Preconditioning: Apply 3 cycles of pressurization from 10 to 120 mmHg at a constant flow rate.
- Passive Pressure-Diameter Relation: Inflate vessel from 0 to 180 mmHg in 10 mmHg increments under zero-flow conditions. Record outer diameter via video microscopy.
- Wall Thickness Measurement: At conclusion, freeze vessel, section, and stain (e.g., H&E) to measure medial thickness.
- Data Analysis: Calculate circumferential stress (σ = P·ri / h, where P=pressure, ri=internal radius, h=wall thickness) and strain (ε = (ri - r{i,ref}) / r_{i,ref}, with reference at 80 mmHg). Plot stress-strain curve. The incremental Young's modulus is the slope of the linear portion of this curve (typically 100-140 mmHg).
Protocol: Assessing TGF-β Pathway Modulation by ARB
Objective: To quantify the effect of ARB treatment on aortic TGF-β/Smad signaling.
- Animal Model: Use fibrillin-1 hypomorphic (mgR/mgR) or Ang II-infused mice.
- Intervention: Administer Losartan (0.6 g/L in drinking water) vs. placebo for 8-12 weeks.
- Tissue Processing: Homogenize snap-frozen aortic tissue in RIPA buffer with protease/phosphatase inhibitors.
- Western Blot: Resolve protein (30 µg/lane) on 4-12% Bis-Tris gel. Transfer, block, and probe sequentially for:
- Phospho-Smad2/3 (Ser423/425)
- Total Smad2/3
- TGF-β1 (latent and active forms)
- GAPDH (loading control).
- Immunohistochemistry: Paraffin sections (5 µm) stained with antibodies for p-Smad2/3 and MMP-9. Quantify positive nuclear staining (p-Smad) per high-power field.
Protocol: Clinical Assessment of PWV Response to SGLT2i
Objective: To non-invasively measure aortic PWV in a clinical trial of an SGLT2 inhibitor.
- Study Design: Randomized, double-blind, placebo-controlled, parallel-group trial (e.g., 26 weeks).
- Patient Population: Adults with Type 2 Diabetes and established atherosclerosis.
- Intervention: Empagliflozin 10 mg daily vs. matched placebo.
- Measurement (Baseline & Week 26):
- Participants rest supine in a temperature-controlled room for 10 min.
- Applanation tonometry (e.g., SphygmoCor) is performed at the carotid and femoral arteries.
- The time delay (Δt) between the feet of the carotid and femoral waveform peaks is calculated via cross-correlation.
- The carotid-femoral path length is measured as the surface distance from the carotid site to the femoral site minus the distance from the carotid to the suprasternal notch.
- Aortic PWV = path length (m) / Δt (s).
- Statistical Analysis: ANCOVA model comparing adjusted mean change from baseline in PWV between groups.
Signaling Pathways & Mechanistic Diagrams
Diagram Title: Core Pathways in Aortic Stiffening & Intervention Targets
Diagram Title: Validation Pipeline for Aortic Stiffness Interventions
The Scientist's Toolkit: Research Reagent Solutions
Table 3: Essential Materials for Aortic Stiffness & Intervention Research
| Item / Reagent | Function in Research | Example Product / Specification |
|---|---|---|
| Pressure Myograph System | For ex vivo biomechanical testing (pressure-diameter relationship). Essential for direct calculation of Young's modulus. | DMT 110P Wire Myograph or Living Systems CH-1 Pressure Myograph. |
| High-Fidelity Tonometry | Non-invasive measurement of carotid-femoral Pulse Wave Velocity (PWV) in clinical/conscious animal studies. | SphygmoCor XCEL, Millar applanation tonometer. |
| TGF-β Activity Assay | Quantifies active vs. latent TGF-β in serum or tissue lysates to assess pathway engagement. | R&D Systems DuoSet ELISA (DY240). |
| Phospho-Smad2/3 (Ser423/425) Antibody | Key IHC/WB reagent for detecting downstream TGF-β receptor signaling activation. | Cell Signaling Technology #8828. |
| MMP-9 Activity Assay | Fluorometric or zymographic assessment of gelatinase activity in aortic tissue homogenates. | Abcam ab119571 (Fluorometric). |
| Picrosirius Red Stain Kit | Histological staining for collagen; can be combined with polarized light for collagen I/III differentiation. | Sigma-Aldrich (Direct Red 80). |
| Elastin Van Gieson (EVG) Stain Kit | Histological staining for elastic fibers; critical for assessing medial elastin fragmentation. | Sigma-Aldrich (HT25A). |
| SGLT2 Inhibitor (for research) | For preclinical in vivo studies to model pharmacologic intervention. | MedChemExpress, HY-104008 (Dapagliflozin). |
| Angiotensin II Receptor Blocker | For preclinical in vivo studies to block AT1R. | Sigma-Aldrich, L-9773 (Losartan potassium). |
| Advanced Glycation End-product (AGE) ELISA | Quantifies serum or tissue levels of AGEs (e.g., CML, pentosidine), linking metabolic state to stiffness. | Cell Biolabs STA-817 (Competitive ELISA). |
This whitepaper provides an in-depth technical guide for the precise correlation of mechanical property measurements with histopathological features of the extracellular matrix (ECM). It is framed within a broader thesis on elucidating the biomechanical mechanisms of arterial aging, which posits that age-related increases in aortic Young's modulus are not merely a function of compositional change, but are critically driven by specific, quantifiable microstructural alterations: elastin fragmentation and advanced collagen cross-linking. Accurate benchmarking of modulus against these histological gold standards is essential for validating non-invasive imaging techniques, understanding disease progression, and developing targeted pharmacotherapies for conditions like arterial stiffening.
Table 1: Key Quantitative Relationships Between Modulus and Histological Metrics
| Aortic Layer | Young's Modulus Range (kPa) | Primary Histological Correlate | Key Quantitative Metric | Reported Correlation (R²) | Aging Trend |
|---|---|---|---|---|---|
| Media | 50 - 500 (Low Strain) | Elastin Fiber Integrity | Mean Elastin Fiber Length (µm) or Fragmentation Index | 0.65 - 0.85 (Inverse) | Modulus ↑ with Fragmentation ↑ |
| Media-Adventitia | 1,000 - 10,000 (High Strain) | Collagen Cross-linking | Pyridinoline Content (mol/mol collagen) or Pentosidine Level | 0.70 - 0.90 (Positive) | Modulus ↑ with Cross-link ↑ |
| Whole Wall | 200 - 2,000 | Composite Score | Combined Elastin/Collagen Histomorphometry + Biochemical Assay | >0.80 | Modulus ↑ with Composite Degradation Score ↑ |
Table 2: Common Experimental Techniques for Correlation
| Modality | Technique | Measured Parameter | Corresponding Histology/Biochemistry |
|---|---|---|---|
| Mechanical | Biaxial Tensile Testing | Tangent Young's Modulus (Low & High Strain) | Site-matched Verhoeff-Van Gieson & Picrosirius Red |
| Mechanical | Atomic Force Microscopy (AFM) | Nano-indentation Modulus | Immunofluorescence (Elastin/Collagen) on adjacent section |
| Biochemical | HPLC/MS-MS | Pyridinoline, Pentosidine, DESMOSINE | Hydroxyproline for collagen normalization |
| Imaging | Nonlinear Microscopy (SHG/TPEF) | Collagen/Elastin Morphology & Orientation | Direct validation of imaging metrics |
Detailed Experimental Protocols
3.1. Integrated Workflow for Direct Correlation This protocol ensures spatially registered data acquisition.
- Sample Preparation: Human or murine aortic segments are harvested and divided into adjacent rings.
- Mechanical Testing: One ring is subjected to planar biaxial testing in physiological saline at 37°C. A stress-strain curve is generated. The tangent modulus is calculated at low strain (elastin-dominated phase, ~5-15%) and high strain (collagen-dominated phase, >30%).
- Histological Processing: The adjacent ring is fixed in formalin and paraffin-embedded. Serial sections (5 µm) are cut.
- Staining & Imaging:
- Elastin Fragmentation: Verhoeff-Van Gieson stain. High-resolution brightfield imaging. Use image analysis (e.g., FIJI/ImageJ) to calculate mean elastin fiber length and number of breaks per unit area.
- Collagen Structure & Cross-linking: Picrosirius Red stain imaged under polarized light for organization. Adjacent sections may be used for immunofluorescence targeting specific cross-links (e.g., anti-pyridinoline).
- Biochemical Validation: Homogenate from a third adjacent ring is analyzed via HPLC for quantitative cross-link measurement (pyridinoline, pentosidine) and ELISA for desmosine (elastin degradation marker).
- Data Correlation: Mechanical modulus values are plotted against histological and biochemical indices using linear or multiple regression models.
3.2. Atomic Force Microscopy (AFM)-Based Nano-mechanical Mapping For micro-scale correlation.
- Sample Prep: Fresh/frozen aortic cryosections (10-20 µm) are mounted on glass slides.
- AFM Indentation: Using a silicon nitride tip (spring constant ~0.1 N/m), force-volume maps are acquired over a region of interest (e.g., 50x50 µm).
- Modulus Calculation: Force-indentation curves are fitted with a Hertzian model to generate a spatial map of elastic modulus.
- Correlative Microscopy: The same section is immediately stained (e.g., autofluorescence for elastin, Second Harmonic Generation for collagen) or immunolabeled. Overlaying the AFM map and fluorescence image allows direct pixel-to-pixel correlation of modulus with specific ECM structures.
Signaling and Workflow Diagrams
Title: Integrated Workflow for ECM Modulus-Histology Correlation
Title: Pathways Linking Aging to Modulus via ECM Changes
The Scientist's Toolkit: Research Reagent Solutions
Table 3: Essential Materials for Correlative Studies
| Item | Function & Application |
|---|---|
| Planar Biaxial Test System | Applies controlled stress in two orthogonal directions to vessel samples, enabling calculation of anisotropic material properties and tangent modulus. |
| Atomic Force Microscope with PF-QNM | Enables nanoscale mapping of elastic modulus on tissue sections via Peak Force Quantitative Nanomechanical Mapping mode. |
| Verhoeff's Van Gieson (VVG) Stain Kit | Specific histochemical stain for elastin fibers (black), allowing visualization and quantification of fragmentation. |
| Picrosirius Red Stain Kit | Stain for collagen. When viewed under polarized light, provides data on collagen density and alignment (birefringence). |
| Anti-Pyridinoline Antibody | Primary antibody for immunofluorescence detection of this major enzymatic collagen cross-link in tissue sections. |
| Collagen Type I ELISA Kit | Quantifies total collagen content from tissue lysates, used to normalize cross-link biochemical data. |
| Desmosine ELISA Kit | Quantifies desmosine, a unique marker of elastin degradation and turnover, in serum or tissue hydrolysates. |
| Pentosidine ELISA Kit | Quantifies pentosidine, a well-characterized advanced glycation end-product (AGE) cross-link in collagen. |
| High-Performance Liquid Chromatography (HPLC) System | Gold-standard method for separation and quantitative detection of specific collagen cross-links (pyridinoline) in acid hydrolysates. |
| Image Analysis Software (e.g., FIJI, QuPath) | Critical for quantifying histological parameters: fiber length, fragmentation index, cross-sectional area, and orientation from digital images. |
Within the broader thesis on age-related aortic stiffening, this whitepaper addresses the critical need for non-invasive biomarkers that can accurately reflect underlying mechanical changes, specifically increases in aortic Young's modulus. The extracellular matrix (ECM) undergoes continuous remodeling with age, driven by altered protease activity and collagen/elastin turnover, directly contributing to vascular stiffening. Simultaneously, circulating microRNAs (miRNAs) have emerged as stable, disease-associated signaling molecules that regulate pathways central to ECM homeostasis. This guide details the integration of these biomarker classes to create a multi-parametric profiling approach for predicting mechanical properties.
Core Mechano-Biological Relationships
The relationship between circulating biomarkers and aortic Young's modulus is mediated through specific cellular and molecular pathways.
Diagram Title: Pathway from miRNA Dysregulation to Aortic Stiffness
Key Biomarker Tables
Table 1: Circulating miRNAs Associated with Aortic Stiffness and ECM Remodeling
| miRNA | Direction in Aging/Stiffness | Validated mRNA Targets | Proposed Mechanistic Role | Correlation with Pulse Wave Velocity (r-value) |
|---|---|---|---|---|
| miR-29b | Downregulated | COL1A1, COL3A1, ELN | Loss of repression elevates collagen/elastin production | -0.67 to -0.72 |
| miR-21-5p | Upregulated | PTEN, SPRY1 | Enhances TGF-β & pro-fibrotic signaling | +0.58 to +0.63 |
| miR-145-5p | Downregulated | KLF5, TGFBR2 | Derepresses TGF-β receptor signaling | -0.48 to -0.55 |
| miR-133a | Downregulated | CTGF, COL1A1 | Attenuates fibroblast-to-myofibroblast transition | -0.52 |
| miR-181b | Downregulated | MMP-9 | Leads to increased MMP-9 activity | -0.45 |
Table 2: Circulating ECM Turnover Markers
| Marker | Type/Origin | Physiological Role | Change with Age/Stiffness | Reported Serum/Plasma Concentration in Aging |
|---|---|---|---|---|
| Pro-Collagen III N-Terminal Propeptide (PIIINP) | Synthesis byproduct (Collagen III) | Reflects collagen III synthesis/fibrosis | ↑ | 3.5 - 6.2 µg/L ↑ (vs. 2.1-4.1 µg/L in young) |
| Collagen I C-Terminal Telopeptide (CITP) | Degradation fragment (Collagen I) | Reflects collagen I degradation by MMPs | ↑ | 4.8 - 7.9 ng/mL ↑ (vs. 3.0-5.2 ng/mL) |
| Matrix Metalloproteinase-9 (MMP-9) | Active enzyme | Degrades elastin, collagens IV/V | ↑ Activity | 450 - 720 ng/mL ↑ (activity assays) |
| Tissue Inhibitor of Metalloproteinase-1 (TIMP-1) | Inhibitor | Inhibits MMP-9, MMP-3 | ↑ (but MMP/TIMP ratio increases) | 120 - 180 ng/mL ↑ |
| Elastin-Derived Peptides (EDP) | Degradation fragment (Tropoelastin/Elastin) | Reflects elastic fiber breakdown | ↑ | 20-40% increase reported |
Experimental Protocols for Correlation Studies
Protocol A: Parallel Biomarker & Mechanical Testing in Rodent Models
Objective: To establish direct correlations between circulating biomarkers and ex vivo aortic Young's modulus.
Materials:
- Aged rodent cohort (e.g., 24-month-old C57BL/6 mice) vs. young controls.
- Blood collection tubes (EDTA for plasma, serum separator).
- TRIzol LS for RNA stabilization from liquid samples.
- Specific ELISA Kits: Human/Mouse PIIINP (e.g., Cloud-Clone), Total MMP-9 (R&D Systems), TIMP-1 (Abcam).
- qRT-PCR Reagents: TaqMan MicroRNA Assays (miR-29b, miR-21), cDNA synthesis kit, Universal PCR Master Mix.
- Biaxial or Uniaxial Tensile Testing System (e.g., Instron 5543).
- Pressure Myograph System for functional stiffness assessment.
Methodology:
- In Vivo Measurement: Under anesthesia, measure carotid-femoral Pulse Wave Velocity (cfPWV) as a surrogate for in vivo stiffness.
- Terminal Blood Collection: Collect plasma (EDTA) and serum. Aliquot and freeze at -80°C.
- Aortic Excision: Perfuse with PBS, excise thoracic aorta, remove adventitial fat.
- Mechanical Testing:
- Cut into 3mm ring segments.
- Mount on biaxial tester, precondition in physiological saline at 37°C.
- Apply uniaxial tension at a constant strain rate (e.g., 0.1 mm/s).
- Record force-displacement data. Calculate Engineering Stress (σ = Force/Initial Cross-Sectional Area) and Strain (ε = ΔL/L0).
- Fit data to a linear model within the physiological strain range (typically 5-10%) to derive the Incremental Young's Modulus (Einc).
- Biomarker Assays:
- miRNA Quantification: Isolate total RNA from plasma using miRNeasy Serum/Plasma Kit. Perform reverse transcription with miRNA-specific stem-loop primers. Quantify via qPCR using TaqMan probes. Normalize to spiked-in cel-miR-39.
- ECM Marker Quantification: Run ELISAs on serum/plasma per manufacturer protocols. Use a standard curve for absolute quantification.
- Statistical Correlation: Perform linear regression or Spearman correlation between log-transformed biomarker levels and ex vivo Young's Modulus.
Protocol B: In Vitro Stiffness-MiRNA Secretion Assay
Objective: To determine if substrate stiffness directly modulates miRNA secretion from vascular smooth muscle cells (VSMCs).
Materials:
- Polyacrylamide Hydrogels of tunable stiffness (1 kPa, 8 kPa, 25 kPa) coated with collagen I.
- Primary human aortic VSMCs.
- Serum-free collection media.
- Exosome Isolation Reagent (e.g., Total Exosome Isolation kit).
- NanoSight NS300 for exosome characterization.
- Small RNA Sequencing Library Prep Kit.
Methodology:
- Cell Plating: Seed early-passage VSMCs onto characterized hydrogels.
- Conditioned Media Collection: After 72 hours, replace with exosome-depleted serum-free media. Collect conditioned media after 24 hours.
- Exosome & miRNA Isolation: Isolate exosomes via precipitation. Extract total RNA.
- miRNA Profiling: Prepare libraries for next-generation sequencing or perform qPCR array for fibrosis-associated miRNAs.
- Data Analysis: Correlate secreted miRNA levels (e.g., exosomal miR-21) with substrate stiffness.
Integrated Research Workflow
Diagram Title: Biomarker-Mechanics Correlation Workflow
The Scientist's Toolkit: Essential Research Reagents & Materials
| Item | Vendor Examples | Function/Application |
|---|---|---|
| TaqMan Advanced miRNA cDNA Synthesis Kit | Thermo Fisher Scientific | Converts miRNA to cDNA for sensitive, specific qPCR quantification from biofluids. |
| miRNeasy Serum/Plasma Kit | Qiagen | Purifies high-quality total RNA, including small RNAs, from low-volume liquid samples. |
| Procollagen III N-Terminal Propeptide (PIIINP) ELISA | Cloud-Clone, Novus Biologicals | Quantifies collagen III synthesis activity in serum; key fibrosis marker. |
| Human MMP-9 Total Quantikine ELISA | R&D Systems | Measures total (pro- and active) MMP-9 protein levels. |
| ExoQuick-TC Exosome Precipitation Solution | System Biosciences | Isolates exosomes from conditioned cell culture media for miRNA cargo analysis. |
| Polyacrylamide Hydrogel Kit | Cell Guidance Systems, BioVision | Creates substrates of defined stiffness for mechanotransduction studies. |
| Pressure Myograph System (110P) | Danish Myo Technology | Measures vascular lumen diameter and pressure to calculate distensibility and elastic modulus in real-time. |
| Mouse/Rat PWV System | Indus Instruments | Non-invasive measurement of aortic pulse wave velocity in rodent models. |
| Luminex xMAP Human MMP Panel | R&D Systems, Millipore | Multiplex quantification of multiple MMPs and TIMPs from a single sample. |
| Spike-in Control: cel-miR-39-3p | Qiagen, Thermo Fisher | Synthetic miRNA added during RNA isolation to normalize for extraction efficiency in biofluid miRNA studies. |
This integrated approach, correlating dynamic circulating biomarkers with intrinsic mechanical properties, provides a powerful framework for non-invasive monitoring of aortic aging and evaluating novel anti-stiffening therapeutics.
Conclusion
The age-related increase in aortic Young's modulus is a well-validated, central biomechanical phenotype of vascular aging, driven by profound extracellular matrix remodeling. A multi-modal methodological approach, combining ex vivo mechanical testing with advanced in vivo imaging, is essential for accurate quantification, though researchers must rigorously control for prevalent confounding factors. The validated trajectory of stiffening provides a critical quantitative endpoint for preclinical and clinical research. Future directions must focus on developing highly targeted therapies to decouple chronological age from aortic biomechanics, refining non-invasive biomarkers of tissue-level stiffness, and integrating multi-omics data with biomechanical models to enable personalized prediction and intervention in age-related cardiovascular disease.