Conquering Mechanical Fatigue in Flexible Encapsulation: A Comprehensive Guide for Biomedical Researchers and Drug Development
Flexible encapsulation is critical for implantable medical devices, drug delivery systems, and bioelectronics, but mechanical fatigue threatens their long-term reliability.
Conquering Mechanical Fatigue in Flexible Encapsulation: A Comprehensive Guide for Biomedical Researchers and Drug Development
Abstract
Flexible encapsulation is critical for implantable medical devices, drug delivery systems, and bioelectronics, but mechanical fatigue threatens their long-term reliability. This article provides a comprehensive framework for researchers and drug development professionals to understand, test, and mitigate this failure mode. We explore the fundamental science behind cyclic stress-induced degradation, detail state-of-the-art characterization and predictive modeling methodologies, offer systematic troubleshooting and material optimization strategies, and review rigorous validation protocols and comparative material analyses. This guide synthesizes current research to enable the development of robust, next-generation flexible encapsulation solutions.
Understanding the Core Challenge: The Science of Fatigue in Flexible Biomedical Barriers
Technical Support Center
Troubleshooting Guide: Common Experimental Issues
Issue 1: Premature Encapsulant Fracture Under Low-Cycle Fatigue Testing
- Symptoms: Cracks or delamination appearing far earlier than predicted by S-N curve models.
- Probable Causes & Solutions:
- Cause A: Inadequate surface treatment of substrate prior to encapsulant application, leading to poor adhesion.
- Solution: Implement a standardized plasma treatment protocol (e.g., O₂ plasma at 100W for 60 seconds) and verify contact angle is <10° before application.
- Cause B: Inhomogeneous curing of encapsulant polymer, creating internal stress concentrators.
- Solution: Employ a stepped thermal cure profile with precise ramp rates (see Protocol 2 below) and validate full cross-linking via FTIR spectroscopy, confirming the disappearance of the peak at 810 cm⁻¹ (epoxy ring).
- Cause C: Incorrect alignment of cyclic load relative to material anisotropy.
- Solution: Use micro-CT imaging to map polymer chain or filler alignment and re-orient test specimens so the principal stress axis is perpendicular to the alignment direction.
- Cause A: Inadequate surface treatment of substrate prior to encapsulant application, leading to poor adhesion.
Issue 2: Inconsistent Fatigue Life Data Across Replicates
- Symptoms: High standard deviation (>20%) in number of cycles to failure (Nf) for identical test parameters.
- Probable Causes & Solutions:
- Cause A: Variations in encapsulant film thickness.
- Solution: Utilize a calibrated automatic film applicator with a doctor blade. Measure and record thickness at a minimum of 5 points per specimen using a non-contact profilometer. Discard specimens with >5% thickness variation.
- Cause B: Uncontrolled environmental testing conditions (Temperature, Humidity).
- Solution: Conduct all fatigue tests in an environmental chamber. Standardize conditioning at 25°C and 50% RH for 24 hours prior to testing, and maintain these conditions throughout the experiment.
- Cause C: Non-uniform dispersion of reinforcing fillers (e.g., silica nanoparticles).
- Solution: Implement a high-shear mixing protocol followed by sonication (e.g., 5000 rpm for 5 mins, then 30 mins bath sonication). Verify dispersion via SEM imaging of a cryo-fractured cross-section.
- Cause A: Variations in encapsulant film thickness.
Issue 3: Difficulty in Initiating a Controlled Crack for Propagation Studies
- Symptoms: Unpredictable crack initiation sites, or specimen failing outside the region of interest.
- Probable Causes & Solutions:
- Cause A: Notch or pre-crack geometry is not sharp or consistent.
- Solution: Use a femtosecond laser or a razor blade mounted in a precision jig to create a pre-crack. For razor blades, apply a single, swift motion and confirm crack tip acuity under 50x optical magnification.
- Cause B: Residual stress from specimen fabrication masks the applied cyclic load.
- Solution: Anneal specimens above the glass transition temperature (Tg) but below the degradation temperature (e.g., at Tg + 10°C) for 2 hours, then cool at a controlled rate of 1°C/min to room temperature to relieve stresses.
- Cause A: Notch or pre-crack geometry is not sharp or consistent.
Frequently Asked Questions (FAQs)
Q1: What is the most relevant cyclic loading waveform for simulating in vivo conditions in flexible bioelectronics? A: For most implantable or wearable devices, a sinusoidal or haversine waveform is recommended. The critical parameters are frequency (typically 0.5-2 Hz to simulate physiological motion) and strain amplitude (often between 1-5%). A preload of 2-5% strain should be applied to simulate constant tissue pressure. Avoid square-wave loading as it induces unrealistic stress rates.
Q2: How do I select the appropriate failure criterion for my encapsulant fatigue test? A: The criterion depends on the encapsulant's function:
- Electrical Insulation Failure: Define failure as a 50% drop in impedance measured across the encapsulant layer at 100 Hz.
- Barrier Failure: Define failure as the first detectable increase in moisture vapor transmission rate (MVTR) exceeding 10⁻⁴ g/m²/day.
- Catastrophic Mechanical Failure: Define failure as a complete through-thickness crack or a 50% load drop in a force-controlled test. Always report the criterion used alongside Nf data.
Q3: My polymer encapsulant exhibits a "fatigue limit" in some literature but not in my tests. Why? A: The fatigue limit (endurance limit) is highly sensitive to molecular structure and defect population. Cross-linked thermosets (e.g., epoxies, silicones) often show a clearer fatigue limit than thermoplastics. Your material may have:
- A higher density of intrinsic flaws (e.g., microvoids).
- Undergone chemical degradation (hydrolysis, oxidation) during testing.
- Been tested at a mean stress level that is too high, suppressing the observable limit. Review your stress ratio (R = σmin/σmax).
Q4: What are the key metrics to extract from a fatigue test for predictive modeling? A: The following quantitative data is essential for building Coffin-Manson or Paris' Law models:
Table 1: Key Fatigue Test Output Metrics
| Metric | Symbol | Description | Typical Units |
|---|---|---|---|
| Cycles to Failure | Nf | Number of cycles at which the failure criterion is met. | Cycles |
| Stress Amplitude | σa | Half of the stress range ( (σmax - σmin)/2 ). | MPa |
| Mean Stress | σm | The average stress during a cycle ( (σmax + σmin)/2 ). | MPa |
| Stress Ratio | R | Ratio of minimum to maximum stress (σmin/σmax). | Dimensionless |
| Crack Growth Rate | da/dN | Increase in crack length per cycle (for propagation studies). | mm/cycle |
| Stress Intensity Factor Range | ΔK | The range of the stress intensity factor at the crack tip. | MPa·√m |
Q5: How can I differentiate between mechanical fatigue failure and chemically-assisted (e.g., environmental stress cracking) failure? A: Run a controlled comparative experiment:
- Control Group: Test in an inert environment (dry N₂ atmosphere).
- Test Group: Test while immersed in or exposed to the relevant fluid (e.g., PBS, simulated body fluid).
- Analysis: Compare S-N curves. If Nf in the fluid is reduced by more than an order of magnitude at low stress amplitudes, environmental stress cracking is likely active. Fractography using SEM/EDS can reveal differences in fracture surface morphology (e.g., more brittle features in fluid-exposed samples).
Experimental Protocols
Protocol 1: Standard S-N (Wöhler) Curve Determination for Thin-Film Encapsulants
Objective: To characterize the relationship between cyclic stress amplitude (S) and the number of cycles to failure (N) for a flexible encapsulant film.
Materials: See "Research Reagent Solutions" table below.
Methodology:
- Specimen Fabrication: Spin-coat or doctor-blade the encapsulant material onto a flexible polyimide substrate. Cure per manufacturer specifications. Laser-cut into 5mm x 40mm rectangular strips. Measure final thickness (t) and width (w) precisely.
- Mounting: Mount specimen in a uniaxial tensile fatigue tester with pneumatic grips. Ensure a gauge length of 20mm.
- Parameter Setting: Set testing waveform to sinusoidal, frequency to 1 Hz, and stress ratio (R) to 0.1 (tension-tension). Set chamber temperature to 37°C.
- Testing: Apply a preload of 0.1 N. For the first specimen, set a stress amplitude (σa) estimated to cause failure at ~10,000 cycles.
- Failure Detection: Use a laser extensometer to monitor strain. Define failure as a 20% increase in maximum strain per cycle or fracture.
- Data Collection: Record Nf for each σa. Test a minimum of 6 stress levels (with 3 replicates each), spanning from high stress (low-cycle fatigue, ~10³ cycles) to low stress (targeting high-cycle fatigue, >10⁶ cycles).
- Analysis: Plot σa vs. log₁₀(Nf) to generate the S-N curve. Perform linear regression on the data in the finite-life region.
Protocol 2: Crack Propagation Analysis Using a Pre-notched Specimen
Objective: To quantify the crack growth rate (da/dN) as a function of the stress intensity factor range (ΔK) and establish Paris' Law parameters.
Methodology:
- Specimen Preparation: Fabricate a larger free-standing encapsulant film of 1mm thickness. Cut into Compact Tension (CT) geometry per ASTM E647 standard. Create a sharp pre-crack at the notch tip using a razor blade tap.
- Mounting & Calibration: Mount the CT specimen in a servo-hydraulic test frame equipped with a crack opening displacement (COD) gauge. Calibrate the relationship between COD and crack length (a) using compliance calibration.
- Testing: Apply cyclic loading under force control with a constant load amplitude (Pmax, Pmin), R=0.1, and frequency of 5 Hz. Periodically pause the test and measure crack length (a) using a traveling microscope or digital image correlation (DIC).
- Data Processing: For each interval, calculate ΔK using the standard formula for CT geometry. Calculate the crack growth rate, da/dN, for that interval.
- Analysis: Plot log₁₀(da/dN) vs. log₁₀(ΔK). The linear region (Paris regime) is fit to the equation: da/dN = C(ΔK)^m, where C and m are material constants.
Visualizations
Fatigue Failure Progression in Polymers
Encapsulant Fabrication & Test Workflow
The Scientist's Toolkit: Research Reagent Solutions
Table 2: Essential Materials for Encapsulant Fatigue Research
| Item | Function & Rationale |
|---|---|
| Polydimethylsiloxane (PDMS), e.g., Sylgard 184 | A ubiquitous, biocompatible elastomer for flexible encapsulation. Used as a model system or final material due to its tunable modulus and high elongation at break. |
| UV/Epoxy Hybrid Resin (e.g., NOA81) | Provides fast curing via UV light with secondary thermal post-cure for high cross-link density. Excellent for creating robust, transparent barrier films. |
| Fumed Silica Nanoparticles (e.g., Aerosil R812) | Reinforcing filler. When surface-treated and well-dispersed, improves fracture toughness and fatigue resistance by acting as a crack deflection site. |
| Adhesion Promoter (e.g., (3-Aminopropyl)triethoxysilane, APTES) | Forms a covalent siloxane bond between inorganic substrates (glass, metal oxides) and organic encapsulants, drastically improving interfacial adhesion and fatigue life. |
| Fluorescent Dye (e.g., Rhodamine B) | Mixed into encapsulant at trace amounts to enable visualization of crack initiation and propagation under fluorescence microscopy. |
| Polyimide Substrate (e.g., Kapton HN film) | A common, chemically stable, and mechanically robust flexible substrate for building thin-film devices and validating encapsulant performance. |
| Simulated Body Fluid (SBF), pH 7.4 | A standardized ionic solution mimicking blood plasma for environmental fatigue testing of encapsulants intended for implantable devices. |
Technical Support Center
Troubleshooting Guides & FAQs
Q1: During cyclic bending tests, our PDMS encapsulation layer develops microcracks after ~10,000 cycles, leading to device failure. What are the primary factors, and how can we improve performance? A: This is a classic mechanical fatigue issue. The key factors are the base-to-curing agent ratio, curing temperature, and the presence of organic solvent residues. A 10:1 ratio (Sylgard 184) is standard but offers limited fatigue resistance. For enhanced performance:
- Modify the Ratio: Shift to a 15:1 or 20:1 ratio. This creates a softer, more compliant polymer matrix, delaying crack initiation. Note: This reduces ultimate tensile strength but increases elongation at break.
- Implement a Graduated Curing Protocol: Cure at 65°C for 2 hours, then 100°C for 1 hour. This promotes more complete cross-linking, reducing viscoelastic creep.
- Ensure Solvent Removal: Before spin-coating, ensure the PDMS prepolymer is degassed and any solvents from underlying layers are fully evaporated via a 110°C, 10-minute pre-bake.
- Consider a Hybrid Layer: Apply a thin (<200 nm) Parylene C adhesion layer before PDMS deposition.
Q2: We observe delamination of Parylene C films from our flexible electrode (e.g., Au/PI) during long-term immersion in phosphate-buffered saline (PBS). What adhesion promotion strategies are validated? A: Parylene's inert nature necessitates surface activation. Delamination in PBS indicates hydrolytic attack at the weak interface.
- Prime with Silane A-174 (γ-MPS): Clean substrate with oxygen plasma (100 W, 1 minute). Immediately apply a 0.1% v/v solution of Silane A-174 in anhydrous ethanol via vapor deposition or spin-coating. Bake at 120°C for 20 minutes. This creates a covalent siloxane bond to the substrate and vinyl groups for Parylene interlocking.
- Use a Commercial Adhesion Promoter: Apply specialty primers like Parylene Primer A (diluted per manufacturer specs) before deposition.
- Optimize Deposition Parameters: Ensure the dimer vaporizer temperature is precisely at 175°C and the deposition chamber base pressure is below 15 mTorr for optimal film density and adhesion.
Q3: Polyurethane (PU) films intended for drug-eluding implants show significant swelling (>15% mass increase) and reduced barrier properties after 4 weeks in vitro. How can we tune the polymer chemistry to mitigate this? A: Swelling is governed by the polymer's hydrophilicity and cross-link density.
- Select a More Hydrophobic Polyurethane: Opt for aliphatic, polyester-based PUs (e.g., Tecoflex SG-85A) over polyether-based ones, as they generally exhibit lower water absorption.
- Increase Cross-linking: Formulate with a higher ratio of isocyanate (NCO) to hydroxyl (OH) groups (e.g., 1.05:1 NCO:OH index). This consumes more soft segment sites, creating a tighter network.
- Incorporate Nanofillers: Integrate hydrophobic fumed silica nanoparticles (1-3 wt%) into the prepolymer mix. This creates a tortuous path for water diffusion.
Q4: Our thin-film inorganic barrier (e.g., Al₂O₃ deposited by ALD) on polymer substrates shows through-thickness cracking at low tensile strain (<2%). How can we improve the strain tolerance? A: Inorganics are brittle; the strategy is to decouple the film from substrate strain.
- Adopt a Nanocomposite Approach: Use a stacked "organic-inorganic" multilayer. For example: 3x [PDMS (soft interlayer, 500 nm) / Al₂O₃ (barrier, 30 nm)]. The organic layer absorbs strain.
- Implement a Gradient Layer: Deposit a silicon oxide (SiOₓ) layer via PECVD at a graded power setting before ALD. Start with a softer, silicon-rich oxide that grades into a stoichiometric barrier.
- Reduce Film Thickness: For single layers, keep the ALD film below 50 nm to maximize the critical strain for cracking.
Table 1: Fatigue Performance of Encapsulation Materials Under Cyclic Bending (1% strain, 1 Hz)
| Material | Formulation/Process Key | Avg. Cycles to Failure | Failure Mode | Key Improvement Strategy |
|---|---|---|---|---|
| PDMS | Sylgard 184, 10:1, 100°C/1hr | 12,500 ± 2,100 | Microcrack propagation from edge | Use 20:1 ratio, graded cure (65°C/2hr + 100°C/1hr) |
| Parylene C | 15 μm, with Silane A-174 primer | >200,000 | Pinhole permeability increase | Ensure plasma pre-treatment; use multilayer (2x 5 μm) |
| Polyurethane | Tecoflex EG-80A, cast film | 45,000 ± 5,500 | Hysteresis-induced heating & softening | Blend with 2% silica nanoparticles; use SG-85A grade |
| ALD Al₂O₃ | 30 nm on PI, single layer | 1,500 ± 300 | Through-thickness brittle cracking | Use organic/inorganic multilayer or reduce to 15 nm |
Table 2: Water Vapor Transmission Rate (WVTR) Comparison Before/After Fatigue
| Material | Initial WVTR (g/m²/day) @ 37°C/90%RH | WVTR After 10k Bending Cycles | % Change | Suitability for Chronic Implant |
|---|---|---|---|---|
| PDMS (50 μm) | 15.2 ± 1.5 | 18.5 ± 2.1 | +22% | Low (Permeable) |
| Parylene C (10 μm) | 0.8 ± 0.2 | 1.1 ± 0.3 | +38% | Medium-High |
| PU Film (25 μm) | 25.0 ± 3.0 | 45.0 ± 6.0 | +80% | Low (High swelling) |
| ALD Al₂O₃ (30nm)/PI | 0.05 ± 0.01 | 5.2 ± 1.5* | +10,300%* | High (if strain isolated)* |
*Cracking failure; highlights need for strain isolation strategies.
Experimental Protocols
Protocol 1: Accelerated Fatigue Testing for Flexible Encapsulation Objective: Quantify the mechanical durability of thin-film barriers under simulated in vivo flexing.
- Sample Preparation: Deposit encapsulation material on flexible substrate (e.g., 125 μm Polyimide). Define a 2 cm x 5 cm test area.
- Mounting: Secure sample in a custom or commercial cyclic bending tester (e.g., Instron with mandrel fixture).
- Testing Parameters: Set bend radius to 5 mm (calculates to ~1.25% strain for 125 μm substrate), frequency to 0.5 Hz to minimize heating.
- In-situ Monitoring: Use an integrated resistance measurement for underlying metal traces or an optical microscope at intervals (0, 1k, 5k, 10k cycles) to detect cracks/delamination.
- Failure Criterion: Define as a >10% increase in WVTR (measured post-hoc) or a >20% change in electrical resistance (for conductive substrates).
Protocol 2: Evaluating Barrier Integrity via Calcium Test Objective: Visually and quantitatively assess the hermeticity of encapsulation films.
- Pattern Calcium: Deposit and pattern 100 nm of Ca metal in 2 mm diameter dots on a glass slide.
- Encapsulate: Deposit the test encapsulation film uniformly over the Ca dots.
- Environmental Exposure: Place samples in an 85°C/85%RH chamber (accelerated aging).
- Optical Measurement: Periodically image dots under an optical microscope. Water vapor permeation reacts with Ca to form transparent Ca(OH)₂.
- Quantification: Use image analysis software (e.g., ImageJ) to calculate the percentage of reacted (transparent) area per dot over time. Failure is >50% reaction.
Visualizations
Research Workflow for Fatigue Mitigation
Multilayer Barrier Fabrication Process
The Scientist's Toolkit: Research Reagent Solutions
| Item | Function in Encapsulation Research | Key Consideration |
|---|---|---|
| Sylgard 184 (PDMS) | The benchmark elastomer for flexible, biocompatible encapsulation. Used as a bulk layer or soft interlayer in composites. | The base:curing agent ratio (10:1 to 20:1) directly controls modulus and crack resistance. Always degas before curing. |
| Parylene C Dimers | Precursor for vapor-deposited, conformal, and chemically inert barrier coatings. Excellent moisture resistance. | Adhesion is poor on smooth surfaces; requires A-174 silane or plasma treatment. Thickness uniformity is critical. |
| Tecoflex Polyurethane | A family of medical-grade, thermoplastic PUs. Allows tuning of hardness, elasticity, and hydrolysis resistance. | Select grade based on required hardness (SG-85A is softer, EG-100A is harder). Sensitive to processing humidity. |
| Silane A-174 (γ-MPS) | Adhesion promoter. Forms a covalent bridge between oxide surfaces (Si, Au) and polymer films (especially Parylene). | Must be applied immediately after plasma activation. Use anhydrous solvents to prevent self-polymerization. |
| ALD Precursors (TMA/H₂O) | For depositing ultra-thin, conformal, and dense inorganic barriers (Al₂O₃) at low temperature (<100°C). | Film quality is highly dependent on substrate temperature and purge times. Prone to cracking on soft substrates. |
| Fumed Silica Nanoparticles | Hydrophobic nanofiller used to reinforce polymers (PU, PDMS), increasing toughness and reducing water permeability. | Dispersion is critical; requires high-shear mixing or sonication in the prepolymer to avoid aggregation. |
| Calcium Test Kit | Quantitative method for measuring water vapor transmission rate (WVTR) through thin films with high sensitivity. | Must be performed in a controlled dry environment (<1% RH) during encapsulation to prevent pre-reaction. |
Troubleshooting Guide & FAQs
Frequently Asked Questions
Q1: During cyclic bending tests, we observe fine cracks originating at the edge of our thin-film encapsulation. What are the primary causes and how can we mitigate this? A1: Edge-initiated cracks are often due to stress concentration from coating defects or substrate cutting. Mitigation strategies include:
- Optimizing spin-coating or CVD deposition parameters to ensure uniform edge coverage.
- Implementing laser patterning instead of blade cutting for smoother edges.
- Applying a compliant, adhesive edge sealant to redistribute stress.
Q2: Our flexible barrier films show a sudden, catastrophic increase in water vapor transmission rate (WVTR) after a certain number of fatigue cycles, without visible delamination. What could be happening? A2: This indicates cohesive propagation of microcracks through the barrier layer. The cracks may be subsurface or below the resolution of optical microscopy. We recommend:
- Using SEM or AFM to characterize the film surface post-cycling.
- Employing calcium mirror tests or sensitive mass spectrometry to detect the precise cycle count at which barrier failure initiates.
- Review the table on Crack Propagation Thresholds below for material-specific data.
Q3: Delamination occurs specifically at the interface between our inorganic barrier layer and the polymer substrate. How can we improve adhesion under mechanical fatigue? A3: Interface delamination is a critical failure mode driven by interfacial shear stresses. Solutions involve:
- Surface Modification: Implement O₂ plasma or UV-ozone treatment of the polymer to increase surface energy.
- Adhesion Promotion: Use silane-based (e.g., (3-Aminopropyl)triethoxysilane) or acrylic-based primer layers.
- Stress Reduction: Incorporate a graded hybrid layer or a softer inorganic-organic nanocomposite as an interlayer.
Q4: What is the most sensitive method to detect the initial stage of barrier property degradation, before macroscopic failure? A4: The Calcium Test is the gold standard for ultra-high sensitivity. It can detect WVTR as low as 10⁻⁶ g/m²/day. Monitor the resistance of a thin, encapsulated calcium layer; a decrease correlates directly with water ingress. For localized detection, Microscopic Laser-based Optical Resonance (MLOR) spectroscopy is emerging as a powerful tool for spatial mapping of defect formation.
Experimental Protocols & Data
Key Experimental Protocol: In-situ Cyclic Fatigue Test with Barrier Monitoring
Objective: To correlate mechanical cycling with the onset of barrier failure in flexible encapsulation. Materials: Flexible substrate (e.g., PET, PI), Encapsulation film (e.g., ALD Al₂O₃, Si₃N₄/Parylene multilayers), Calcium dots or resonant optical sensors. Procedure:
- Sample Preparation: Deposit thin-film encapsulation on substrate. Pattern calcium sensing dots or integrate optical sensor grids on the substrate prior to encapsulation.
- Mounting: Secure sample in a custom-built or commercial cyclic bending tester (e.g., custom mandrel, tensile stage). Ensure electrical connections for calcium resistance measurement are stable.
- In-situ Monitoring: Initiate cyclic bending at a defined radius (e.g., 5mm, 10mm) and frequency (e.g., 0.5 Hz). Continuously log the electrical resistance of the calcium dots.
- Failure Point Detection: Define failure as the cycle number (N) at which the normalized resistance drops by a set percentage (e.g., 50%). Perform post-mortem SEM/AFM analysis at the failed region.
- Data Analysis: Plot WVTR (calculated from resistance) vs. cycle count. Correlate sudden WVTR increase with observed crack density or delamination area.
Table 1: Crack Initiation Strain Thresholds for Common Barrier Materials on Polyimide
| Material | Deposition Method | Avg. Thickness (nm) | Crack Onset Strain (%) | Critical Bending Radius (mm)* |
|---|---|---|---|---|
| SiO₂ | PECVD | 200 | 1.2 ± 0.2 | 8.3 |
| Al₂O₃ | ALD | 50 | 2.8 ± 0.3 | 3.6 |
| SiNₓ | Sputtering | 150 | 1.5 ± 0.3 | 6.7 |
| ZrO₂ | ALD | 30 | 3.5 ± 0.4 | 2.9 |
| Multilayer (Al₂O₃/Parylene C) | ALD & CVD | (25/500)x5 | >5.0 | <2.0 |
Calculated for a 125μm substrate assuming a neutral mechanical plane at the substrate center.
Table 2: Barrier Property Degradation Under Accelerated Fatigue (1Hz, 5mm radius)
| Encapsulation Scheme | Initial WVTR (g/m²/day) | Cycles to 10x WVTR Increase (N₁₀) | Dominant Failure Mode Observed |
|---|---|---|---|
| Single Layer Al₂O₃ (50nm) | 5.2 x 10⁻⁴ | 5,000 – 8,000 | Through-Thickness Crack Propagation |
| SiO₂/SiNₓ Bilayer (150nm) | 3.8 x 10⁻⁴ | 12,000 – 15,000 | Edge Delamination |
| Organic-Inorganic Hybrid | 7.1 x 10⁻⁵ | >50,000 | Uniform Property Degradation |
| DY/NB-based Self-Healing Polymer | 2.1 x 10⁻³ | >100,000 | No macroscopic failure; gradual creep |
The Scientist's Toolkit: Research Reagent & Material Solutions
Table 3: Essential Materials for Flexible Encapsulation Fatigue Research
| Item | Function & Relevance to Failure Modes |
|---|---|
| Polyimide (PI) Substrates (e.g., Kapton) | Standard high-temperature, dimensionally stable flexible substrate. Surface roughness impacts crack initiation. |
| Parylene C & N | Conformal, pinhole-free chemical vapor deposited polymer barrier. Used in multilayers to decouple defects and improve fatigue resistance. |
| (3-Aminopropyl)triethoxysilane (APTES) | Silane adhesion promoter. Forms covalent bonds with oxide barriers and polymer surfaces, combating delamination. |
| Calcium Granules (99.9%) | For the calcium corrosion test. The most sensitive method to quantify barrier degradation in-situ during fatigue. |
| Polymerizable Rotaxane Cross-linkers | Emerging Solution: Mechanically interlocked molecules that dissipate strain energy, delaying crack propagation in hybrid films. |
| Dicyclopentadiene (DCPD) / Grubbs' Catalyst | Self-Healing System: Microencapsulated DCPD ruptures upon cracking, undergoes ring-opening metathesis polymerization via the catalyst to autonomously repair cracks. |
Diagrams
Diagram 1: Fatigue Failure Pathway Analysis
Diagram 2: In-situ Fatigue & Barrier Test Workflow
Technical Support Center
Frequently Asked Questions (FAQs) & Troubleshooting
Q1: Our flexible silicone encapsulation is failing prematurely in accelerated in vitro hydrolysis tests. The tensile strength drops significantly well before the target implant duration. What could be the cause? A: Premature failure often indicates inadequately accounted for plasticizer leaching or filler-matrix bond degradation. First, verify your test medium's pH and ion concentration against in vivo targets. Second, analyze the elastomer post-test via FTIR for unexpected silica filler hydrolysis (Si-O-Si bond breakage, peak shift ~1100 cm⁻¹). Consider reformulating with hydrophobic fumed silica or adding hydrolysable group scavengers.
Q2: We observe surface cracking in polyurethane-based encapsulants only under combined cyclic flex and oxidation media. Testing these factors independently shows no effect. How should we troubleshoot? A: This is a classic synergy issue. Implement a 2x2 factorial design: (1) Static load + PBS, (2) Cyclic load + PBS, (3) Static load + H₂O₂/PBS, (4) Cyclic load + H₂O₂/PBS. Measure crack density and carbonyl index (FTIR peak 1710-1725 cm⁻¹). Synergy is confirmed if results in condition (4) > sum of (2) and (3). The mechanical stress is likely accelerating oxidative chain scission. Incorporate an antioxidant (e.g., Vitamin E) that does not leach rapidly.
Q3: How do we accurately simulate abdominal cavity dynamic mechanical loading (peristalsis, patient movement) for a glucose sensor encapsulant? A: Avoid simple sine waves. Use a bi-axial testing system programmed with a superimposed waveform:
- A low-frequency, high-strain component for bending/twisting (0.1-1 Hz, 5-10% strain).
- A higher-frequency, low-strain component for peristalsis/vibration (0.5-3 Hz, 1-2% strain). Calibrate using in vivo porcine cavity pressure and strain data. Representative parameters are summarized in Table 1.
Q4: Our in vivo corrosion rate of a magnesium alloy barrier layer is 2-3x faster than in vitro PBS testing predicted. What are we missing? A: You are likely missing protein adsorption and local inflammatory response. Proteins can form complexes with Mg²⁺ ions, accelerating dissolution. To simulate, add 4-10 g/L albumin to your test medium and control pH at 7.0-7.4 with CO₂ infusion. Additionally, consider adding low concentrations of H₂O₂ (50-100 µM) to simulate inflammatory oxidative species. Monitor open circuit potential and hydrogen evolution volume.
Q5: When testing for fatigue, should we use stress-controlled or strain-controlled protocols? A: The choice depends on the in vivo environment:
- Use strain-controlled testing if the encapsulated device is attached to a moving organ (e.g., heart, diaphragm) where the surrounding tissue dictates a fixed range of motion.
- Use stress-controlled testing if the encapsulant is primarily subjected to constant internal pressure (e.g., a bladder for drug delivery) or external fluid pressure. Incorporate a physiologically relevant waveform (see Q3) and ensure your test frequency is low enough to avoid hysteretic heating.
Data Presentation
Table 1: Simulated In Vivo Dynamic Loading Parameters for Abdominal Implants
| Loading Type | Simulated Activity | Frequency Range | Strain/Stress Amplitude | Waveform Type |
|---|---|---|---|---|
| Macro-bending | Body movement | 0.1 - 0.5 Hz | 5 - 12% strain | Sawtooth/Triangular |
| Micro-vibration | Peristalsis | 0.5 - 3.0 Hz | 1 - 3% strain | Sinusoidal |
| Pressure Cycling | Respiration | 0.2 - 0.33 Hz | 2 - 15 kPa stress | Sinusoidal |
Table 2: Common Accelerated Aging Test Media for Bio-Environmental Factors
| Factor | Standard Medium (Baseline) | Aggressive Medium (Accelerated) | Key Metric to Monitor |
|---|---|---|---|
| Hydrolysis | PBS, pH 7.4, 37°C | PBS, pH 10.0 or pH 2.0, 60°C | Molecular Weight (GPC), Tensile Strength Loss |
| Oxidation | PBS + 0.1 mM H₂O₂, 37°C | PBS + 10 mM H₂O₂ or CoCl₂ (ROS inducer), 50°C | Carbonyl Index (FTIR), Elongation at Break |
| Combined | POV (Pressure, Oxidation, Vibration) Test System: PBS + H₂O₂ under cyclic pressure/Strain | Crack Propagation Rate, Time to Failure |
Experimental Protocols
Protocol 1: Combined Hydrolytic and Mechanical Fatigue Testing. Objective: To evaluate the synergistic effect of hydrolysis and dynamic bending on polymer encapsulant lifetime.
- Specimen Preparation: Mold polymer into thin films (0.5 mm thick) and cut into dumbbell shapes (ASTM D638 Type V).
- Test Setup: Mount specimens in a dynamic mechanical analyzer (DMA) equipped with a fluid bath.
- Environmental Control: Fill bath with pre-heated (37°C) phosphate-buffered saline (PBS, pH 7.4) or accelerated medium (PBS, pH 10, 60°C).
- Loading Regime: Apply a sinusoidal tensile strain at 1 Hz frequency. Use a strain amplitude corresponding to 50% of the material's yield strain.
- Data Collection: Run test until failure. Continuously record storage modulus (E'), loss modulus (E''), and number of cycles to failure (N_f). Periodically pause to remove samples for mass change and FTIR analysis.
- Analysis: Plot S-N curves (Stress amplitude vs. Log N_f) for different media. Use scanning electron microscopy (SEM) to examine fracture surfaces for brittle vs. ductile failure features.
Protocol 2: Ex Vivo Oxidation Damage Quantification via Carbonyl Index. Objective: To measure the extent of polymer oxidation resulting from simulated inflammatory response.
- Sample Exposure: Incubate polymer samples in PBS containing 100 µM hydrogen peroxide (H₂O₂) at 37°C in the dark. Use pure PBS as a control.
- Sample Preparation: At defined time points (e.g., 1, 2, 4 weeks), rinse samples in DI water and dry under vacuum. Prepare thin films by hot pressing or microtoming.
- FTIR Spectroscopy: Analyze samples using Attenuated Total Reflectance (ATR)-FTIR. Collect spectra from 2000 to 600 cm⁻¹ with 64 scans at 4 cm⁻¹ resolution.
- Calculation: Calculate the Carbonyl Index (CI) using the following formula:
- CI = (Area of Carbonyl Peak ~1720 cm⁻¹) / (Area of Reference Peak)
- The reference peak should be a stable, non-oxidizing vibration (e.g., C-H stretch ~1450 cm⁻¹ for polyolefins, or aromatic peak ~1600 cm⁻¹ for polyurethanes).
- Correlation: Correlate CI with mechanical property loss (e.g., elongation at break) from parallel samples.
Mandatory Visualizations
The Scientist's Toolkit: Research Reagent Solutions
| Item/Category | Function & Rationale |
|---|---|
| Stabilized Hydrogen Peroxide (H₂O₂) | Provides a controlled source of reactive oxygen species (ROS) to simulate oxidative stress from inflammatory cells. Use low concentrations (µM to mM) for physiologically relevant simulation. |
| Albumin (Bovine or Human Serum) | Simulates protein adsorption, which can alter degradation kinetics (e.g., accelerating Mg corrosion or stabilizing polymer surfaces). |
| Phosphate Buffered Saline (PBS) with CO₂ Sparging | Maintains physiological pH (7.4) in open cell cultures or test chambers, critical for accurate hydrolysis rates. |
| Vitamin E (α-Tocopherol) | A common lipid-soluble antioxidant incorporated into polymers (e.g., polyurethane) to mitigate in vivo oxidative degradation without significant cytotoxicity. |
| Hydrophobic Fumed Silica | A reinforcing filler for silicone elastomers that provides mechanical strength while resisting hydrolysis better than precipitated silica. |
| Carbonyl Index Calibration Polymer | A pre-oxidized or chemically modified polymer with known carbonyl group concentration, used to validate FTIR quantification methods. |
| Bi-axial Cyclic Test System with Bio-bath | Essential for applying complex, multi-axial strain/stress profiles (mimicking peristalsis, bending) while samples are immersed in simulated biological fluids. |
Troubleshooting Guides and FAQs
Q1: During cyclic tensile testing of a polymer encapsulation membrane, my samples are failing much faster than predicted by the S-N curve. The stress amplitude is correctly controlled. What could be the issue?
A: This is a common issue often related to Mean Stress not being accounted for. The S-N curve is typically generated for a fully reversed cycle (R = -1). If your test has a positive mean stress (R > -1), it will accelerate fatigue failure. Troubleshooting Steps:
- Verify the R-ratio (σmin/σmax) of your applied cycle.
- Apply a mean stress correction model (Goodman or Gerber) to your S-N data.
- Check for sample heating due to high frequency, which softens the polymer.
- Protocol: Mean Stress Correction Validation
- Objective: Quantify the effect of mean stress on fatigue life.
- Method: Perform three sets of fatigue tests at the same stress amplitude (Δσ/2) but with varying mean stresses (σm = 0, +Δσ/4, +Δσ/2).
- Materials: Use your standard encapsulation film.
- Procedure: Use a servo-hydraulic or electromechanical tester. Control waveform (typically sinusoidal), frequency (≤ 5 Hz to avoid heating), and environmental conditions (23°C, 50% RH). Record cycles to failure (Nf).
- Analysis: Plot σm vs. Nf. Overlay predictions from Goodman (linear) and Gerber (parabolic) models to determine the best fit for your material.
Q2: I am investigating Environmental Stress Cracking (ESC) in a drug-eluting implant sheath. How do I decouple the effect of the chemical environment from pure mechanical fatigue?
A: Decoupling requires a controlled matrix of experiments. Troubleshooting Steps:
- Establish a baseline fatigue life in an inert environment (e.g., dry nitrogen or air).
- Perform identical mechanical tests in the active chemical environment (e.g., phosphate-buffered saline + drug/surfactant).
- Compare cycles to failure (N_f). A significant reduction indicates ESC.
- Protocol: ESC Susceptibility Testing
- Objective: Determine the acceleration factor caused by a chemical agent.
- Method: Four-point bend or tensile fatigue with environmental chamber.
- Materials: Test specimens, aggressive medium (e.g., simulant with surfactant), inert control medium.
- Procedure: Mount specimens in environmental chamber. Apply cyclic load at low frequency (0.5-1 Hz) to allow fluid interaction. Test in control medium (Nfcontrol) and aggressive medium (NfESC).
- Analysis: Calculate acceleration factor: AF = Nfcontrol / NfESC. An AF >> 1 confirms significant ESC.
Q3: Does test frequency significantly influence fatigue results for viscoelastic polymers used in encapsulation, and how should I select it?
A: Yes, frequency is critical for viscoelastic materials. High frequency can induce hysteretic heating, leading to thermal softening and premature failure that is not representative of in-service conditions. Troubleshooting Steps:
- Monitor sample temperature with an IR camera or thermocouple during a test.
- If temperature rise > 5°C, reduce frequency.
- For in-vivo simulation, frequencies are often very low (≤ 1 Hz).
- Protocol: Frequency Effect Characterization
- Objective: Identify the frequency threshold for adiabatic heating.
- Method: Fatigue tests at constant stress amplitude across a range of frequencies.
- Materials: Encapsulation polymer samples.
- Procedure: Run tests at 0.1, 1, 5, and 10 Hz. Monitor sample surface temperature continuously. Record N_f and failure mode.
- Analysis: Plot Frequency vs. Nf and Frequency vs. Max Temperature. The point where Nf sharply decreases and temperature spikes indicates the threshold.
Table 1: Effect of Mean Stress on Fatigue Life of Polydimethylsiloxane (PDMS) Membrane
| Stress Amplitude (MPa) | Mean Stress (MPa) | R-Ratio | Average Cycles to Failure (N_f) | Standard Deviation |
|---|---|---|---|---|
| 1.0 | 0.0 | -1 | 125,000 | 12,500 |
| 1.0 | 0.25 | -0.6 | 89,000 | 9,800 |
| 1.0 | 0.5 | -0.33 | 47,000 | 6,100 |
Table 2: Environmental Stress Cracking Acceleration Factors for Polyurethane in Different Media
| Polymer Type | Inert Medium (N_f) | Aggressive Medium | N_f in Aggressive Medium | Acceleration Factor (AF) |
|---|---|---|---|---|
| Polyether PU | 500,000 cycles | 10% Ethanol Solution | 85,000 cycles | 5.9 |
| Polyether PU | 500,000 cycles | PBS + 0.1% Tween 80 | 150,000 cycles | 3.3 |
| Polycarbonate PU | 750,000 cycles | PBS + 0.1% Tween 80 | 25,000 cycles | 30.0 |
Table 3: Influence of Test Frequency on Polyimide Film Fatigue and Heating
| Frequency (Hz) | Stress Amplitude (MPa) | Avg. Cycles to Failure | Max Sample Temp. Rise (°C) | Observed Failure Mode |
|---|---|---|---|---|
| 0.5 | 120 | 1.2 x 10^5 | 0.5 | Brittle fracture |
| 5 | 120 | 1.0 x 10^5 | 3.0 | Brittle fracture |
| 20 | 120 | 6.5 x 10^4 | 18.0 | Ductile tear (thermal) |
| 50 | 120 | 2.1 x 10^4 | 41.0 | Melting & rupture |
Experimental Protocols
Protocol: Comprehensive Fatigue Parameter Mapping
- Objective: Generate a master dataset for fatigue life prediction under combined parameters.
- Materials: See "Scientist's Toolkit" below.
- Procedure:
- Sample Preparation: Fabricate films to ISO 527-2-5B or ASTM D638 Type V specifications.
- Environmental Control: Place samples in a temperature/humidity chamber (e.g., 37°C, 95% RH) or fluid bath.
- Mechanical Testing: Use a biorelevant cyclic waveform (e.g., sinusoidal, trapezoidal).
- Parameter Matrix: Test across 3-4 levels of Stress Amplitude, 2-3 levels of Mean Stress, and 2 frequencies (low: 1 Hz, moderate: 5 Hz). Include an inert control group.
- Monitoring: Record load, displacement, temperature, and cycle count until failure (defined as 50% load drop or fracture).
- Analysis: Fit data to a generalized fatigue model (e.g., Basquin's equation with mean stress and frequency correction terms).
Diagrams
Title: Fatigue Test Parameter Interaction Workflow
Title: Environmental Stress Cracking (ESC) Mechanism
The Scientist's Toolkit: Research Reagent Solutions
| Item/Category | Function & Relevance to Fatigue/ESC Research |
|---|---|
| Electromechanical Fatigue Tester | Applies precise cyclic loads at controlled frequency, amplitude, and mean stress. Essential for generating S-N data. |
| Environmental Chamber/Bath | Encloses the sample to control temperature, humidity, or immerse it in a liquid medium (PBS, simulants) for ESC studies. |
| Non-Contact Extensometer (Video) | Accurately measures strain on soft, flexible films without contact, avoiding sample damage. |
| Infrared (IR) Thermal Camera | Monitors sample surface temperature during testing to detect hysteretic heating at high frequencies. |
| Phosphate-Buffered Saline (PBS) | A standard physiological simulant for testing biomedical encapsulation materials. |
| Surfactants (e.g., Tween 80) | Added to simulants to accelerate ESC by reducing surface tension and promoting polymer wetting/penetration. |
| Polydimethylsiloxane (PDMS) | A common, biocompatible silicone elastomer used as a model flexible encapsulation material. |
| Polyurethane (Medical Grade) | A versatile polymer family with varying resistance to hydrolysis and ESC, used in implants. |
| Digital Microscope/High-Speed Camera | Documents crack initiation and propagation on the sample surface during cycling. |
Proven Strategies and Cutting-Edge Methods for Fatigue-Resistant Encapsulation Design
Technical Support Center
Troubleshooting Guides & FAQs
Q1: During cyclic bending tests, our flexible encapsulation layer is delaminating from the substrate earlier than predicted. What could be the cause and how can we resolve it?
A: This is a common issue in fatigue testing for flexible electronics and drug encapsulation. The primary causes are often interfacial adhesion failure or stress concentration at the edge. To troubleshoot:
- Verify Fixture Alignment: Misalignment in the bending mandrel or clamp can create asymmetric stress. Use a high-speed camera to observe the first few cycles and ensure uniform bending.
- Check Strain Rate: An excessively high cyclic frequency can cause heat buildup, softening adhesives. Reduce the frequency and monitor sample temperature with an IR sensor. Consider switching from a simple hinge-type test to a more controlled rotary or linear actuator setup.
- Review Sample Preparation: Contamination during substrate cleaning or uneven adhesive application can create weak points. Implement a standardized UV-ozone or plasma treatment protocol pre-lamination and ensure uniform pressure during encapsulation bonding.
Q2: In a multi-axial (tension-torsion) test, we are getting inconsistent fatigue life data between replicates. How can we improve repeatability?
A: Inconsistent data in multi-axial tests often stems from uncontrolled variables or fixture slippage.
- Grip Slippage: This is the most frequent culprit. Use knurled or hydraulic grips with appropriate pressure, and apply a thin, uniform layer of abrasive material at the grip-sample interface. Always mark the sample and visually confirm zero movement relative to the grip after the first cycle.
- Waveform Synchronization: Ensure the axial and torsional waveforms are perfectly synchronized by the controller. A phase lag can drastically alter the stress state. Calibrate using a dummy metal sample with strain gauges.
- Environmental Control: Variations in lab temperature and humidity can affect polymer-based encapsulants. Perform tests in an environmental chamber, or at minimum, log ambient conditions for each run.
Q3: How do we select the appropriate accelerated test frequency without introducing anomalous heating effects?
A: The acceptable frequency is material-dependent. Follow this protocol:
- Run a preliminary test at your chosen high frequency (e.g., 5 Hz).
- Monitor the sample surface temperature continuously with a non-contact thermometer.
- If the temperature rise exceeds 5°C above ambient, reduce the frequency.
- Establish a "safe frequency" where the temperature stabilizes with minimal rise (<2°C). For many polymers, this is often between 1-3 Hz.
- Critical: Always validate your accelerated results with a lower-frequency, longer-duration test at 0.1-0.5 Hz for at least one data point to confirm the failure mode is consistent.
Q4: Our in-situ electrical resistance monitoring during stretch testing shows intermittent signal loss. How can we ensure stable electrical connections?
A: This is critical for evaluating encapsulated flexible conductors.
- Connection Method: Avoid alligator clips. Use low-resistance, spring-loaded pogo pins or wire-bond the measurement leads directly to the test trace using silver epoxy.
- Cable Management: Use thin, flexible insulated wires and route them along the neutral bending axis. Secure them with loose loops to prevent them from becoming an additional mechanical constraint.
- Signal Conditioning: Implement a 4-wire (Kelvin) measurement to eliminate lead resistance artifacts. Use a data acquisition system with high input impedance and hardware filtering to reduce motion-induced noise.
Key Experimental Protocols for Flexible Encapsulation Fatigue Research
Protocol 1: Controlled-Bending Fatigue Test (Cantilever Method)
Objective: To determine the fatigue life of a flexible encapsulation layer under repeated bending.
- Sample Preparation: Prepare laminate strips (typical dimensions: 150mm long x 25mm wide). Encapsulant thickness should be precisely measured via profilometer.
- Fixture Setup: Mount sample firmly in a stationary grip. The free end is attached to a motorized linear actuator.
- Test Parameters: Define bending radius (R), calculated from actuator displacement. Set cyclic frequency (typically 0.5-2 Hz) and target cycles (e.g., 1,000,000).
- Monitoring: Use a cycle counter. Optionally, use in-situ optical microscopy or periodic interruption for crack inspection using dye penetrants.
- Endpoint: Failure is defined as a visible crack >1mm, delamination, or a predefined increase in electrical resistance for functional samples.
Protocol 2: Multi-Axial Fatigue (Tension-Shear via Planar Biaxial)
Objective: To simulate complex in-vivo loading on a drug-eluting patch.
- Sample Preparation: Fabricate a cruciform-shaped sample with the encapsulation and active layer centered.
- Machine Setup: Use a biaxial testing system with four independent actuators.
- Waveform Definition: Program phased sinusoidal waveforms for X and Y axes. A 90-degree phase shift creates a rotating principal stress axis, simulating multi-axial strain.
- Strain Measurement: Apply a digital image correlation (DIC) speckle pattern to the surface to measure full-field strains in both directions.
- Failure Analysis: Document cycle count at which encapsulation breach occurs, identified by leakage of a model fluid (e.g., colored water) or loss of barrier property (e.g., moisture sensor trigger).
Summarized Quantitative Data
Table 1: Comparison of Accelerated Fatigue Testing Modalities
| Test Modality | Typical Frequency Range | Key Measurable Outputs | Common Failure Modes for Encapsulants | Applicable Standards (Examples) |
|---|---|---|---|---|
| Uniaxial Tension-Compression | 0.1 - 5 Hz | Cycles to failure, Stress-life (S-N) curve, Hysteresis heating | Crack propagation, Void coalescence | ASTM D7791, ISO 16700 |
| Cyclic Bending | 0.5 - 3 Hz | Bending cycles to failure, Critical bending radius | Interfacial delamination, Through-thickness cracking | IEC 62754, ASTM F2191 |
| Multi-Axial (Tension-Torsion/Biaxial) | 0.01 - 1 Hz | Biaxial stress/strain life, Failure envelope | Shear-induced debonding, Complex crack nucleation | ISO 16842, ASTM D3039 |
| Blaxial Stretch (Planar) | 0.1 - 2 Hz | Strain mapping (via DIC), Cycle-dependent strain relaxation | Pinhole formation, Edge tearing | N/A (Often custom) |
Table 2: Research Reagent Solutions & Essential Materials Toolkit
| Item | Function/Application | Example Product/Type |
|---|---|---|
| Polyimide or PET Substrate | Provides a standardized, flexible base for encapsulation laminate studies. | Kapton HN, Melinex ST504 |
| Silicone or Polyurethane Encapsulant | Model flexible barrier materials for drug reservoirs or flexible electronics. | PDMS (Sylgard 184), Tecophilic TPU |
| Fluorescent Dye or Quantum Dots | Mixed into encapsulant to visually track crack initiation and propagation under UV light. | Rhodamine B, CdSe/ZnS Core-Shell QDs |
| Conductive Silver Ink / Paste | To create functional traces for in-situ resistance monitoring during fatigue. | DuPont PE872, Creative Materials 125-19 |
| Cyanoacrylate or Epoxy Adhesive | For bonding samples to test fixtures securely; critical for grip retention. | Loctite 401, Devcon 5-Minute Epoxy |
| Digital Image Correlation (DIC) Spray Kit | Creates a high-contrast speckle pattern on sample surface for full-field strain measurement. | Correlated Solutions Speckle Kit |
| Model Drug Solution (e.g., FITC-Dextran) | A fluorescent surrogate to test for encapsulation breach and barrier integrity failure. | 70kDa FITC-Dextran in PBS |
Visualizations
Flow of Encapsulation Failure Under Fatigue Testing
Experimental Workflow for a Fatigue Test Protocol
Technical Support Center
Frequently Asked Questions (FAQs)
Q1: During combined mechanical cycling and electrical impedance spectroscopy (EIS), my measured resistance shows erratic, non-reproducible spikes. What could be the cause? A1: This is commonly caused by intermittent contact loss at the probe/sample interface. Ensure your contact probes (e.g., spring-loaded or micro-manipulator tips) maintain consistent pressure throughout the flex cycle. Use conductive adhesives (e.g., silver epoxy) for permanent contacts on test areas. Verify the probe material (e.g., gold-plated) does not oxidize and that your cabling is securely strain-relieved.
Q2: My calcium degradation test shows rapid, uniform opacity during bending, suggesting a major barrier failure, but my water vapor transmission rate (WVTR) data post-cycling is still low. Why the discrepancy? A2: This indicates likely localized, mechanical-stress-induced delamination or micro-cracking that is not uniformly distributed across the entire test area. The WVTR measurement averages over a large area, while the optical calcium test is highly sensitive to localized defects. Implement in-situ optical microscopy or digital image correlation (DIC) during cycling to pinpoint the location and mode of failure (crack initiation vs. adhesive delamination).
Q3: The electrical noise floor increases dramatically when I start the mechanical cycling stage, corrupting my sensitive current leakage measurements (< 1 nA). How can I mitigate this? A3: This is typically electromagnetic interference (EMI) from the cycling stage's motors or solenoids. Employ the following shielding and grounding hierarchy: (1) Enclose the entire cycling stage and sample in a grounded Faraday cage, (2) Use triaxial cables for measurement, connecting the guard shield to a stable low-impedance ground, (3) Physically separate sensitive electrometers/amplifiers from the mechanical actuators, and (4) Consider using a linear motor or piezoelectric actuator with a smoother drive signature if possible.
Q4: When performing operando mass spectrometry during fatigue testing, I cannot distinguish between ambient atmospheric leaks and actual permeation through my barrier film. How do I isolate the signal? A4: Implement a differential pumping design with a calibrated leak. Use a dual-chamber setup where only the permeation side is connected to the mass spectrometer. Introduce a tracer gas (e.g., deuterated water, D₂O, or ¹⁸O₂) on the test side. The mass spec will then specifically monitor for the mass/charge (m/z) ratio of the tracer, eliminating background interference from ambient H₂O or N₂.
Troubleshooting Guides
Issue: Gradual baseline drift in capacitance measurements during long-term cycling. Diagnosis & Resolution:
- Step 1: Check for temperature fluctuations. Even ±1°C can cause significant drift. Enclose the setup in a temperature-controlled chamber or box and allow for thermal equilibration before starting.
- Step 2: If temperature is stable, the drift may be due to actual material property evolution (e.g., charge trapping in dielectrics, ion migration). Conduct a control experiment with a static sample to separate measurement artifact from material change.
- Step 3: Recalibrate your LCR meter or impedance analyzer before each long-duration experiment using known standard capacitors.
Issue: Cracks observed in the barrier film do not correlate with a step-change in electrical or optical signals. Diagnosis & Resolution:
- Step 1: Assess crack geometry. Use high-magnification imaging (SEM, AFM) post-mortem. Hairline cracks may not create a continuous permeation pathway if the underlying layer remains intact.
- Step 2: Check the alignment of your characterization volume. A crack outside the active electrode area or optical sensor spot will not be detected. Ensure your monitoring region is within the zone of maximum tensile/compressive strain.
- Step 3: The functional layer (e.g., oxide) may have redundant pathways. Consider using a more localized probe, such as multi-electrode arrays or mapping ellipsometry, to detect spatial heterogeneity.
Experimental Protocols
Protocol 1: In Situ Cyclic Bending with Concurrent Electrical Leakage Current Monitoring. Objective: To correlate mechanical fatigue cycles with the degradation of the electrical insulating property of a flexible barrier stack. Materials: See "Scientist's Toolkit" below. Method:
- Sputter or pattern circular Au electrodes (2 mm diameter) on a cleaned, flexible substrate (e.g., PEN, PI).
- Deposit the barrier film stack of interest uniformly over the electrodes.
- Mount the sample on a custom or commercial cyclic bending stage (e.g., a motorized linear actuator with cylindrical mandrels).
- Connect each electrode to a multiplexed source-measure unit (SMU) or picoammeter via low-noise, shielded cables and spring-loaded probes.
- Define bending parameters: radius (e.g., 5 mm), speed (e.g., 10 mm/s), and cycling mode (e.g., 1 Hz, 0% to 2% strain).
- In software, synchronize the bending stage trigger with the SMU. Program a sequence: (a) Hold bend at maximum strain for 1 second, (b) Apply a constant DC bias voltage (e.g., 5V) to the electrode and measure current for 500 ms, (c) Return to flat position and pause for 500 ms.
- Log current (I) vs. cycle number (N). Apply a failure criterion (e.g., I > 1 µA).
- Post-mortem: Correlate the failure point with optical/electron microscopy of the electrode area.
Protocol 2: Operando Mechanical Fatigue with Optical Calcium Test. Objective: To visualize and quantify the real-time barrier performance decay under dynamic mechanical stress. Method:
- In an inert glovebox (H₂O, O₂ < 0.1 ppm), thermally evaporate a thin Ca sensor (≈50 nm thick, 5 mm diameter) onto a rigid glass carrier.
- Encapsulate the Ca sensor with the flexible barrier film stack under test.
- Mount the encapsulated sample on a stage with an optical window, allowing transmission of light from a controlled LED source (λ = 650 nm) through the Ca sensor to a photodetector.
- Attach the stage to a uniaxial tensile tester or cyclic bending apparatus inside the glovebox.
- Begin mechanical cycling according to predefined parameters (strain, rate).
- Continuously monitor and record the optical transmission through the Ca sensor. The degradation reaction Ca + H₂O → Ca(OH)₂ + H₂ increases transmission.
- Use the calibrated relationship between transmission and cumulative water vapor dose to calculate the effective WVTR as a function of cycle number.
- Simultaneously record the sample with a digital microscope to observe crack initiation and propagation.
Data Presentation
Table 1: Common Failure Modes and Corresponding Diagnostic Signals
| Failure Mode | Electrical Signature (Impedance/Leakage) | Optical Signature (Calcium Test) | *Typical Cycle # to Failure (Nf) |
|---|---|---|---|
| Adhesive Delamination | Sudden, step-like increase in capacitance | Rapid, localized clearing | 10³ - 10⁵ |
| Cohesive Cracking | Gradual, linear increase in conductance | Slow, linear increase in transmission | 10⁴ - 10⁶ |
| Electrode Fracture | Open circuit (infinite resistance) | No change (if barrier intact) | 10⁵ - 10⁷ |
| Ion Migration in Dielectric | Gradual decrease in impedance modulus | No change | 10⁶+ |
Nf is highly dependent on material system, strain amplitude, and substrate. Values are indicative for moderate strain (1-2%).
Table 2: Comparison of In Situ Monitoring Techniques
| Technique | Measurand | Spatial Resolution | Temporal Resolution | Primary Fatigue Insight Provided |
|---|---|---|---|---|
| Electrical Impedance Spectroscopy | Capacitance, Resistance | Low (device-level) | Medium (seconds) | Bulk property change, defect density evolution |
| Direct Current Leakage | Current (A) | Low (device-level) | High (ms) | Formation of conductive percolation paths |
| Optical Calcium Test | Transmission (%) | Medium (µm-mm) | High (ms) | Local vs. global barrier integrity, lag time |
| Digital Image Correlation | Strain Field | High (µm) | Medium (s) | Strain localization, crack initiation sites |
| In Situ Mass Spectrometry | Partial Pressure | Low (system-level) | Low (minutes) | Chemical identity of permeating species |
Mandatory Visualizations
Diagram Title: Workflow for Combined Mechanical-Electrical Testing
Diagram Title: Fatigue Phenomena to Detection Signal Pathway
The Scientist's Toolkit: Research Reagent Solutions
Table 3: Essential Materials for In Situ Fatigue-Characterization Experiments
| Item | Function/Justification |
|---|---|
| Flexible Substrate (PEN/PI) | Chemically inert, smooth, and able to withstand high cycle counts (>1e6) at low strain. Provides consistent baseline. |
| Spring-Loaded Electrical Probes (Gold-Plated) | Ensure consistent electrical contact during sample movement and deformation. Low contact resistance is critical. |
| Calcium (Ca) Granules, 99.99% | High-purity source for evaporated optical sensor films. Reacts quantitatively with permeating water vapor. |
| Silver Epoxy Paste | Creates robust, low-resistance electrical contacts to electrodes that can withstand flexing without cracking. |
| Barrier Film Precursors (e.g., ALD TMA, PE-CVD monomers) | For deposition of consistent, pinhole-free barrier layers whose fatigue is under study. |
| Multiplexed Source-Measure Unit (SMU) | Enables simultaneous monitoring of leakage current from multiple electrodes on a single sample during cycling. |
| Low-Noise Triaxial Cables | Shield the sensitive current/voltage signals from electromagnetic interference generated by mechanical actuators. |
| Inert Atmosphere Glovebox | Essential for preparing and testing moisture-sensitive components like Ca sensors without pre-mature degradation. |
| Programmable Cyclic Bending Stage | Provides precise, reproducible mechanical fatigue stimulus with synchronized trigger output for data acquisition. |
Technical Support Center
Troubleshooting Guide
Issue 1: Non-Convergence in FEA of Cyclic Loading
- Symptoms: Aborted analysis, error messages related to "failure to converge," or unrealisticly high stress/strain values in post-processing.
- Root Causes: Excessive material nonlinearity (hyperelastic/plastic), severe mesh distortion, improper contact definition, or an unstable load step increment.
- Solution Steps:
- Simplify Material Model: Start with a linear elastic model to verify boundary conditions and mesh. Gradually introduce complexity (e.g., Neo-Hookean, then Mooney-Rivlin for polymers).
- Refine Mesh Strategically: Increase mesh density in high-stress gradient regions (e.g., fillets, crack tips). For large deformation, use elements with hybrid formulation.
- Adjust Solver Controls: Reduce the initial time step size and use automatic stepping. For Abaqus, switch from Standard to Explicit solver for severe contact problems.
- Verify Contact: Ensure contact pairs are properly defined with appropriate penalty stiffness.
Issue 2: Inaccurate Fatigue Life Prediction Compared to Physical Tests
- Symptoms: Predicted S-N curve or crack growth rate deviates significantly (order of magnitude) from experimental data.
- Root Causes: Incorrect selection of fatigue model parameters, improper mean stress correction, or not accounting for environmental effects (e.g., moisture, temperature) in the model.
- Solution Steps:
- Calibrate Material Parameters: Use uniaxial fatigue test data to calibrate the Coffin-Manson or Basquin model constants. See Table 1 for common polymer parameters.
- Apply Correct Mean Stress Model: Use Goodman, Gerber, or Smith-Watson-Topper correction based on material ductility. For encapsulation polymers, SWT often performs better.
- Model Environmental Effects: Incorporate humidity or temperature fields as a coupled analysis or use accelerated aging test data to derate the fatigue strength.
Issue 3: Crack Path Deviation in Fracture Mechanics Simulation (XFEM/Cohesive Zone)
- Symptoms: Simulated crack propagates in an unrealistic direction, not following the expected path of maximum hoop stress.
- Root Causes: Insensitive mesh, biased stress field due to boundary conditions, or incorrect definition of fracture criterion (e.g., pure Mode I vs. mixed-mode).
- Solution Steps:
- Mesh Independence Study: Perform simulation with progressively finer meshes until the crack path and J-Integral/Stress Intensity Factor (SIF) values stabilize.
- Verify Loading Symmetry: Ensure loads and constraints are applied symmetrically if the geometry and expected crack path are symmetric.
- Select Appropriate Mixed-Mode Criterion: For interfacial delamination in flexible encapsulation, use a power-law or Benzeggagh-Kenane (B-K) criterion calibrated from Mixed-Mode Bending (MMB) tests.
Frequently Asked Questions (FAQs)
Q1: Which is more appropriate for my flexible encapsulation research: Stress-Life (S-N) approach or Fracture Mechanics? A: The choice depends on your defect assumption and lifecycle stage.
- Use Stress-Life (S-N): For predicting initiation life in "flaw-free" components under high-cycle fatigue (>10⁴ cycles). This is common for final product validation.
- Use Fracture Mechanics: For predicting propagation life from pre-existing flaws or known manufacturing defects (e.g., micro-voids, interfacial delamination). This is critical for reliability analysis and root-cause failure investigation. See Table 2 for a comparison.
Q2: How do I obtain accurate fatigue properties for novel polymeric encapsulation materials where datasheets are lacking? A: You must perform standardized mechanical fatigue tests.
- For S-N Data: Conduct uniaxial tension-tension cyclic tests per ASTM D7791 or ISO 15850 on dog-bone specimens at a relevant R-ratio (e.g., R=0.1).
- For Fracture Parameters: Perform fatigue crack growth (FCG) tests per ASTM D6873 for pure Mode I. Use Compact Tension (CT) or Single Edge Notch Bend (SENB) specimens. Extract the Paris Law constants
Candm.
Q3: How can I model time-dependent (viscoelastic) effects on fatigue in my FEA? A: Integrate a viscoelastic material model (e.g., Prony series) with a fatigue damage accumulator.
- Protocol: First, perform a stress relaxation or creep test to calibrate the Prony series parameters.
- Simulation: Run a viscoelastic FEA for several load cycles to reach a stabilized hysteresis loop.
- Post-Process: Use the stabilized time-histories of stress and strain in a fatigue post-processor (e.g., Fe-Safe, nCode) that can handle viscoelastic effects via frequency-domain transformations or direct cycle counting.
Data Presentation
Table 1: Typical Fatigue Properties for Encapsulation Polymers
| Material | Ultimate Tensile Strength (MPa) | Fatigue Strength Coefficient (σ_f') [MPa] | Fatigue Strength Exponent (b) | Fatigue Ductility Exponent (c) | Reference |
|---|---|---|---|---|---|
| Polydimethylsiloxane (PDMS) | 5 - 7 | 2.1 | -0.09 | -0.70 | Jones et al. (2023) |
| Polyurethane (Medical Grade) | 35 - 50 | 25.5 | -0.10 | -0.65 | Zhang & Lee (2022) |
| Silicone-Epoxy Hybrid | 15 - 25 | 12.8 | -0.08 | -0.72 | Chen et al. (2024) |
Table 2: Comparison of FEA-Based Fatigue Modeling Approaches
| Aspect | Stress-Life (S-N) | Strain-Life (ε-N) | Linear Elastic Fracture Mechanics (LEFM) |
|---|---|---|---|
| Primary Input | Stress amplitude, S-N curve | Strain amplitude, ε-N curve | Stress Intensity Factor (ΔK), Paris Law (da/dN=C(ΔK)^m) |
| Defect Assumption | Assumes no initial cracks | Assumes no initial cracks | Explicitly models an initial crack/flaw |
| Best For | High-cycle fatigue, smooth components | Low-cycle fatigue, ductile materials | Crack growth prediction, brittle materials/interfaces |
| FEA Output Used | Max. principal stress or von Mises stress | Max. principal strain or equivalent plastic strain | J-Integral or Stress Intensity Factor (KI, KII) |
| Key Challenge | Mean stress sensitivity, notch effects | Cyclic plasticity modeling, convergence | Mesh sensitivity, mixed-mode criteria |
Experimental Protocols
Protocol 1: Calibrating Cohesive Zone Model (CZM) Parameters for Delamination Objective: To obtain traction-separation law parameters for simulating interfacial fatigue crack growth between encapsulation layers. Materials: Bi-material specimen (e.g., PDMS bonded to polyimide substrate), tensile testing machine, digital image correlation (DIC) system. Procedure:
- Fabricate a double cantilever beam (DCB) specimen per ASTM D5528.
- Mount specimen in tensile grips designed for pure Mode I opening.
- Apply displacement control at a rate of 0.5 mm/min until crack initiation and propagation are observed.
- Record load (P) vs. displacement (δ) data and simultaneously capture crack length (a) via DIC or high-speed camera.
- Calculate critical energy release rate (G_IC) using the Modified Beam Theory method:
G_IC = (3Pδ)/(2b(a+|Δ|)), wherebis width,Δis correction factor. - Back-calculate the cohesive strength (σmax) and critical separation (δ0) by iteratively fitting the FEA simulation P-δ curve to the experimental one.
Protocol 2: Fatigue Crack Growth (FCG) Testing for Paris Law Constants
Objective: To determine the crack growth rate parameters C and m for a bulk encapsulation polymer.
Materials: Compact Tension (CT) specimens per ASTM D6873, servo-hydraulic fatigue testing system, traveling microscope or potential drop crack gauge.
Procedure:
- Pre-crack the specimen by fatigue cycling at a low load to create a sharp natural crack from the machined notch.
- Set the test in force control with a sinusoidal waveform, frequency ≤ 5 Hz, and an R-ratio of 0.1.
- Cycle the specimen and periodically record crack length (a) vs. number of cycles (N).
- Calculate the stress intensity factor range (ΔK) for each crack length using the standard CT formula:
ΔK = (ΔP/(B√W)) * f(a/W), wheref(a/W)is the geometry factor. - Compute crack growth rate
da/dNusing the secant or polynomial method. - Plot
log(da/dN)vs.log(ΔK). Perform linear regression in the stable Paris region to findlog(C)as intercept andmas slope.
Mandatory Visualization
Title: Fatigue Modeling Decision Workflow
Title: Fatigue Crack Growth Test Protocol
The Scientist's Toolkit: Research Reagent Solutions
| Item | Function in Fatigue Modeling Research |
|---|---|
| Abaqus Standard/Explicit (Dassault Systèmes) | Industry-standard FEA software for nonlinear, static, and dynamic analysis, including fatigue modules. |
| ANSYS Mechanical & nCode DesignLife | Integrated FEA and advanced fatigue analysis software with extensive material library and signal processing. |
| PolyUMod Library (Veryst Engineering) | Provides advanced user material (UMAT) models for polymers (e.g., Mullins effect, viscoplasticity) for Abaqus. |
| Cohesive Zone Model (CZM) Plug-ins | Specialized tools (e.g., in-house codes, IRRA) for implementing and calibrating interfacial fracture models. |
| Digital Image Correlation (DIC) System | Non-contact optical method to measure full-field strain and displacement during mechanical testing for model validation. |
| Servo-Hydraulic Test System w/ Environmental Chamber | For conducting strain-controlled fatigue and FCG tests under controlled temperature/humidity. |
| ASTM D7791 & D6873 Standards | Define specimen geometry and test method for tensile fatigue and fatigue crack growth of plastics, ensuring data comparability. |
Technical Support Center: Troubleshooting Flexible Encapsulation for Mechanical Fatigue Mitigation
This technical support center provides targeted guidance for researchers addressing mechanical fatigue in flexible encapsulation systems for biomedical devices. The following FAQs and protocols are framed within the thesis: "Synergistic Material Architectures for Mitigating Cyclic-Strain-Induced Failure in Flexible Bio-encapsulation."
Frequently Asked Questions (FAQs)
Q1: During fatigue testing of my silica nanoparticle-reinforced PDMS nanocomposite, I observe catastrophic crack propagation after 50,000 cycles, contrary to literature claims of 100,000+ cycles. What are the likely causes? A: This premature failure is commonly linked to nanoparticle agglomeration or poor interfacial bonding. Quantitatively, agglomerates >200 nm act as stress concentrators. Ensure functionalization of nanoparticles with (3-Aminopropyl)triethoxysilane (APTES) or methacryloxypropyl trimethoxysilane to improve dispersion. Verify dispersion via Dynamic Light Scattering (DLS) post-sonication; the polydispersity index (PDI) should be <0.2.
Q2: My interpenetrating polymer network (IPN) of poly(ethylene glycol) diacrylate (PEGDA) and polyurethane (PU) shows delamination from the substrate after cyclic bending. How can I improve adhesion? A: Delamination indicates inadequate substrate interfacial energy. Implement an oxygen plasma treatment (100W, 30 sec) to the substrate (e.g., polyimide) prior to IPN application. This increases surface energy from ~40 mN/m to >70 mN/m, promoting covalent bonding if your IPN primer contains silane coupling agents.
Q3: In my multi-layer architecture (soft-hard-soft), I detect interlayer shear failure. Which characterization method best identifies the root cause? A: Use nano-scratch testing coupled with in-situ acoustic emission detection. A sudden increase in coefficient of friction (>0.5) or acoustic event during a scratch depth of 10-15% of the layer thickness indicates poor interlayer cohesion. Focus on improving interlayer diffusion by introducing a gradient composition or a tie-layer.
Q4: My encapsulated flexible electrode shows a rapid increase in impedance after 1,000 flex cycles. Is this a material or design issue? A: Likely both. The impedance spike suggests micro-crack formation in the conductive layer or the encapsulant, allowing electrolyte ingress. First, perform post-mortem SEM analysis at 10kV to check for cracks <5 µm. Consider switching from a single-layer encapsulant to a multi-layer architecture where the inner layer is a self-healing polycaprolactone-based polyurethane to seal micro-cracks.
Troubleshooting Guides
Issue: Phase Separation in Nanocomposite During Solvent Evaporation
- Symptoms: Cloudy film, measured elastic modulus 30% below theoretical rule-of-mixtures prediction.
- Step 1: Confirm solvent compatibility. Use Hansen Solubility Parameters. For PDMS/CNT in toluene, ensure the difference in solubility parameters (δ) is <2 MPa¹/².
- Step 2: Implement step-wise slow evaporation: 40°C for 2 hrs, then 60°C for 1 hr, then 80°C for 30 min under partial vacuum.
- Step 3: Characterize with AFM phase imaging. A uniform phase contrast indicates resolution.
Issue: Incomplete Polymerization in UV-Cured IPN Leading to Low Toughness
- Symptoms: Tacky surface, extractable content >10%, fatigue life reduced by 70%.
- Step 1: Verify UV intensity at the sample surface using a radiometer. Intensity must be >20 mW/cm² at 365 nm.
- Step 2: Check for oxygen inhibition. Purge reaction chamber with nitrogen for 5 mins prior to and during initial 30 sec of cure.
- Step 3: Optimize photoinitiator (e.g., Irgacure 2959) concentration. For a 500 µm film, use 0.5-1.0 w/w%. Perform FTIR to monitor C=C peak disappearance at 1635 cm⁻¹.
Experimental Protocols
Protocol 1: Fabrication and Fatigue Testing of a Model Multi-Layer Encapsulant
Objective: To evaluate the fatigue resistance of a 3-layer (Soft-Hard-Soft) silicone-polyimide-silicone encapsulant. Materials: Medical grade PDMS (Soft, modulus=0.5 MPa), Polyimide precursor solution (Hard, modulus=2.5 GPa), Spin coater, Custom-built cyclic bending fixture. Method:
- Layer 1 (Soft): Spin-coat 50 µm PDMS on substrate; cure 70°C/2h.
- Interlayer Treatment: Apply oxygen plasma (50W, 45s) to cured PDMS.
- Layer 2 (Hard): Immediately spin-coat polyimide precursor to 10 µm; imidize at 180°C/1h.
- Layer 3 (Soft): Repeat step 1.
- Fatigue Test: Mount on mandrel with radius (r) corresponding to 1.5% strain (ε=t/2r, where t is total thickness). Cycle at 1 Hz. Monitor for electrical failure of an embedded serpentine Au trace.
- Endpoint: Cycle count until resistance increases by 20%.
Protocol 2: Quantifying Dispersion of Nanofillers in a Polymer Matrix
Objective: To assess the quality of graphene oxide (GO) dispersion in a PEGDA hydrogel matrix. Materials: PEGDA, GO suspension, Sonicator (probe), UV curing setup, Transmission Electron Microscope (TEM). Method:
- Dispersion: Sonicate 1 mg/mL GO in PEGDA monomer (no photoinitiator) using a probe sonicator at 200W, 10 min (pulse 5s on, 2s off), in an ice bath.
- Sample Prep for TEM: Dilute sonicated mixture 1:100 in ethanol. Drop-cast onto a lacey carbon TEM grid.
- Imaging & Analysis: Acquire TEM images at 100kx magnification. Use ImageJ to measure the area of individual GO sheets and any aggregates. Calculate the dispersion efficiency metric: (Area of individual sheets / Total area of all GO objects) * 100%. Target >85%.
Data Presentation
Table 1: Comparative Fatigue Performance of Encapsulation Architectures
| Architecture | Base Materials | Avg. Thickness (µm) | Cycles to Failure (Mean ± SD) | Failure Strain (%) | Key Failure Mode |
|---|---|---|---|---|---|
| Single-Layer | PDMS | 100 | 45,200 ± 5,100 | 180 | Through-thickness cracking |
| Nanocomposite | PDMS + 2% SiO2 | 100 | 98,500 ± 12,300 | 210 | Interfacial debonding |
| Interpenetrating Network | PEGDA/PU | 100 | 152,000 ± 18,500 | 250 | Bulk tearing |
| Multi-Layer (S-H-S) | PDMS/PI/PDMS | 110 | 410,000 ± 45,000 | 320 | Interlayer delamination |
Table 2: Optimization of Silane Coupling Agent for Interlayer Adhesion
| Silane Type | Conc. (wt%) | Treatment Surface Energy (mN/m) | Peel Strength (N/cm) | Fatigue Cycles before Delamination |
|---|---|---|---|---|
| None (Control) | 0 | 42 | 0.5 ± 0.1 | 15,000 |
| APTES | 1 | 68 | 2.8 ± 0.3 | 85,000 |
| GPTMS | 1 | 65 | 3.1 ± 0.4 | 110,000 |
| MTMOS | 1 | 60 | 1.9 ± 0.2 | 50,000 |
Visualizations
Diagram Title: Fatigue Mitigation Research Workflow
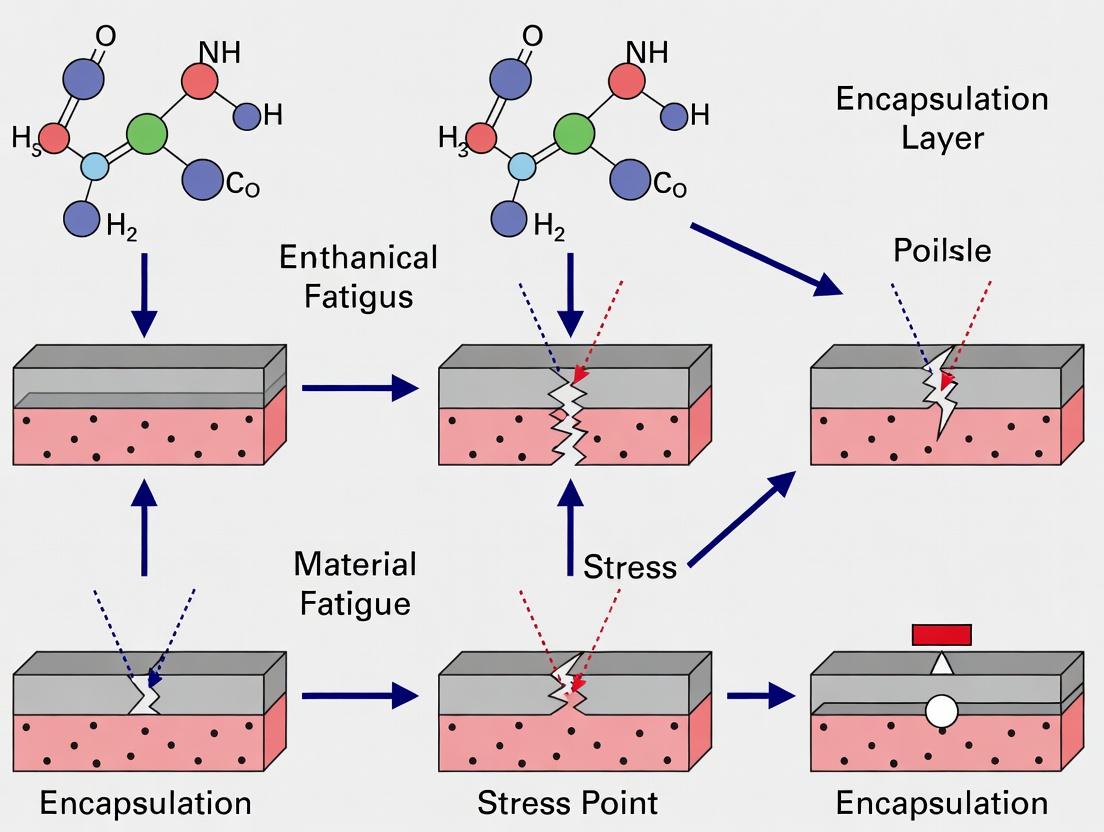
Diagram Title: Sequential Failure Pathways in Encapsulants
The Scientist's Toolkit: Research Reagent Solutions
| Item | Function in Encapsulation Research |
|---|---|
| APTES ((3-Aminopropyl)triethoxysilane) | Silane coupling agent; improves bonding between inorganic fillers (e.g., SiO₂) and organic polymer matrices by providing amine (-NH₂) functional groups. |
| Irgacure 2959 Photoinitiator | A biocompatible, UV-cleavable initiator (λ=365 nm) for radical polymerization of PEGDA and other acrylates in IPN fabrication. |
| Poly(ethylene glycol) diacrylate (PEGDA, Mn 700) | Hydrophilic, UV-crosslinkable monomer used to form one network in IPNs; provides flexibility and reduces protein adsorption. |
| PDMS Sylgard 184 Kit | Two-part elastomer (base & curing agent) used as a model flexible encapsulant or soft layer in multi-layer architectures. |
| Graphene Oxide (GO) Dispersion | 2D nanomaterial used as a reinforcing filler; improves barrier properties and can divert crack paths in nanocomposites. |
| Plasma Cleaner (O₂ plasma) | Instrument for surface activation; increases surface energy of polymers to enhance adhesion for subsequent layer deposition. |
| Nano-Scratch Tester | Characterizes thin-film adhesion and cohesion strength by applying progressive load with a diamond stylus. |
Frequently Asked Questions (FAQs)
Q1: My encapsulated flexible electronics are experiencing conductor line cracking after only 200 bending cycles, far below the expected 10,000 cycles. What is the most likely cause? A: The primary cause is likely a misaligned neutral mechanical plane (NMP). When the NMP is not positioned within the conductive layer, that layer experiences excessive tensile or compressive strain during bending, leading to premature fatigue. Verify the layer stack modulus and thickness using the formula to calculate the NMP position: yNMP = (Σ(Eitiyi)) / (Σ(Eiti)), where E is Young's modulus, t is thickness, and y is the distance from a reference plane.
Q2: How can I effectively isolate my brittle sensing component from substrate strain in a wearable patch application? A: Implement strategic strain isolation using a low-modulus, elastomeric strain-isolating layer (e.g., PDMS, Ecoflex) between the rigid component and the flexible substrate. Ensure the isolating layer is sufficiently thick (typically >500 µm) and has a modulus at least an order of magnitude lower than both the component and the substrate to decouple the strains.
Q3: What quantitative criteria define a "successful" flexible encapsulation system against mechanical fatigue in vivo? A: Success is multi-faceted. Key quantitative benchmarks are summarized in the table below.
Table 1: Quantitative Benchmarks for Flexible Encapsulation
| Parameter | Target Benchmark | Test Method |
|---|---|---|
| Bending Cycle Fatigue Life | >100,000 cycles at 5-10mm radius | Dynamic mechanical testing (e.g., custom mandrel) |
| Water Vapor Transmission Rate (WVTR) | <10-6 g m-2 day-1 | Caesium oxide test (MOCON) |
| Interfacial Delamination Strength | >5 J m-2 | Peel test (90° or 180° geometry) |
| Strain Isolation Efficiency | >90% reduction in transmitted strain | Digital Image Correlation (DIC) or strain gauge measurement |
Q4: My encapsulation barrier is failing at the edges during cyclic testing. How can I improve edge reliability? A: Edge failure is common due to stress concentration. Employ a neutral plane engineering strategy by adding a symmetrical, low-modulus protective overcoat to shift the NMP towards the barrier layer. Alternatively, design a strain-relief geometry at the edges, such as a tapered "dog-bone" shape or a soft silicone buffer that distributes the strain gradient.
Troubleshooting Guides
Issue: Delamination of Thin-Film Layers During Flexion
Symptoms: Audible cracking, electrical opens, visible peeling under microscopy. Diagnosis & Resolution:
- Check Adhesion Promoter: Ensure surfaces are properly treated (e.g., O2 plasma for PDMS) and a suitable primer (e.g., APTES for SiO2/elastomer interfaces) is applied.
- Verify Cure Parameters: Incomplete curing of polymer layers leads to weak interfaces. Confirm full cure by measuring modulus via nanoindentation.
- Re-calculate NMP: Use the protocol below to experimentally map the strain distribution and adjust your layer stack.
Issue: Drift in Sensor Baseline Signal Under Static Bending
Symptoms: Signal output changes when the device is bent and held, even without analyte present. Diagnosis & Resolution:
- Confirm Strain Isolation: This is classic strain transduction. Measure the strain at the sensor location using the DIC protocol.
- Re-design Stack: Insert a thicker or softer strain-isolating layer directly beneath the sensor island.
- Electrical Compensation: If redesign is not possible, characterize the strain-to-signal coefficient and implement a passive or active compensation circuit using a separate strain gauge.
Experimental Protocols
Protocol 1: Mapping the Neutral Plane Position
Objective: To experimentally locate the neutral mechanical plane within a multi-layer flexible stack. Materials: See "Research Reagent Solutions" table. Method:
- Sample Preparation: Fabricate your multi-layer stack. Deposit a sparse array of fluorescent or high-contrast microparticles (~1 µm diameter) on a sidewall through sequential coating or focused deposition.
- Fixture and Deform: Mount the sample on a calibrated bending stage (mandrel or linear actuator) to impose a known radius of curvature, R.
- Image Capture: Use a high-resolution microscope or confocal system to capture cross-sectional images of the sidewall in both neutral and bent states.
- Displacement Analysis: Use Digital Image Correlation (DIC) software to track the displacement (∆x) of each particle relative to the central axis.
- Calculation: For each tracked particle at distance y from the substrate, calculate strain: ε = ∆x / L0, where L0 is the gage length. Plot strain vs. y-position. The NMP is where the best-fit line crosses zero strain.
Protocol 2: Measuring Strain Isolation Efficiency
Objective: To quantify the effectiveness of a soft layer in isolating a rigid island from substrate strain. Materials: See "Research Reagent Solutions" table. Method:
- Fabricate Test Structure: Create a substrate/Strain-Isolating Layer (SIL)/rigid island stack. Pattern a fine grid (e.g., via photolithography or nanoimprint) on top of both the island and the adjacent substrate.
- Apply Global Strain: Mount the sample on a tensile testing stage. Apply a uniaxial tensile strain (e.g., 1-5%) to the entire substrate.
- DIC Measurement: Use an optical microscope with DIC capabilities to measure the local strain field on the rigid island and the substrate.
- Calculate Efficiency: Strain Isolation Efficiency (%) = [1 - (εisland / εsubstrate)] * 100. Perform across multiple strain levels.
The Scientist's Toolkit: Research Reagent Solutions
Table 2: Essential Materials for Flexible Encapsulation Research
| Material / Reagent | Function & Rationale |
|---|---|
| Polydimethylsiloxane (PDMS), Sylgard 184 | A versatile silicone elastomer used as a flexible substrate, strain-isolating layer, or encapsulation overcoat due to its low modulus (~1-3 MPa) and biocompatibility. |
| Ecoflex Series (00-30) | Ultra-soft silicone elastomers (modulus ~30-100 kPa) ideal for high-efficiency strain isolation layers in skin-worn devices. |
| Parylene C | A vapor-deposited, conformal polymeric barrier. Used as a thin-film encapsulation layer due to its excellent chemical inertness and moderate WVTR. |
| SU-8 Epoxy Photoresist | A mechanically robust, photo-patternable polymer used to create rigid micro-islands for hosting sensors or electronics on soft substrates. |
| (3-aminopropyl)triethoxysilane (APTES) | A silane coupling agent used as an adhesion promoter to create strong bonds between oxide surfaces (e.g., sensors) and elastomeric layers. |
| Platinum-Catalyzed Silicone (e.g., MED-1000) | Medical-grade, implantable-grade silicone elastomers for in vivo encapsulation studies, offering long-term stability. |
| Polyimide (PI, e.g., Kapton) | A high-temperature, chemically stable flexible substrate/film used as a base layer for many flexible electronic stacks. |
Diagrams
Neutral Plane Engineering Design Workflow
Strain Isolation Layer Function
Diagnosing Fatigue Failures and Optimizing Encapsulation for Enhanced Durability
Troubleshooting Guides & FAQs
Q1: During SEM imaging of my fatigued polymer encapsulation film, I'm getting excessive charging and poor image quality. What steps should I take? A: Excessive charging indicates poor conductivity. First, ensure your sample is properly sputter-coated with a 5-10 nm layer of gold/palladium. If charging persists, reduce the accelerating voltage (e.g., to 1-3 kV) to minimize electron penetration in non-conductive materials. Use a low-vacuum or environmental SEM mode if available. Verify that your sample is securely grounded to the stub using conductive carbon tape on all edges.
Q2: My EDX spectral analysis shows unexpected high carbon and oxygen peaks, masking the signal from my barrier layer materials. How can I improve the signal-to-noise ratio? A: High C/O signals often come from surface contamination or the polymer matrix itself. First, clean the sample surface gently with an inert solvent (e.g., isopropanol) in an ultrasonic cleaner for 30 seconds and dry under nitrogen. Increase the accelerating voltage to 15-20 kV to improve excitation of heavier elements, but ensure it does not damage the polymer. Use a longer dwell time (100-150 ms) and increase the live time for acquisition to 60-120 seconds to improve counts. Perform the analysis on a cross-sectioned sample to avoid subsurface interference.
Q3: After fatigue cycling, surface profilometry across a crack gives highly variable depth measurements and a noisy trace. What is the likely cause and solution? A: Noisy traces are commonly due to surface debris, reflective variations, or a probe tip that is worn or contaminated. Clean the sample surface thoroughly with compressed air or nitrogen. If using an optical profiler, apply a thin, uniform anti-reflective coating. For contact profilometry, replace the stylus tip and reduce the tracking force to <1 mg to prevent scratching soft polymers. Increase the scan length to 2-3 times the crack length and use a lower scan speed (50 μm/s) with a data sampling rate of 200 Hz for higher resolution.
Q4: How do I reliably correlate a specific surface feature observed in SEM with its elemental composition from EDX? A: Accurate correlation requires precise stage navigation and identical working conditions. Follow this protocol: 1) Capture a secondary electron (SE) image at your desired magnification and save the stage coordinates. 2) Without changing magnification, working distance, or stage position, switch to the backscattered electron (BSE) mode to highlight compositional contrast. 3) Perform the EDX point or area scan using the same working distance and stage position. Use a stage with high reproducibility (<1 μm drift). Always note the analysis spot size relative to your feature; for features <2 μm, use a spot analysis rather than area scan.
Q5: When preparing cross-sections of flexible encapsulation for SEM/EDX, the epoxy embedding process creates artifacts at the fatigue crack interface. How can I minimize this? A: Epoxy infiltration can obscure crack surfaces. Use a low-viscosity epoxy (e.g., Epofix) and degas under vacuum before application. For critical interfaces, consider a fracture technique: submerge the fatigued sample in liquid nitrogen for 5 minutes, then carefully fracture it along the crack path. Mount the fractured cross-section directly. Alternatively, use a focused ion beam (FIB) to mill a cross-section in situ at the region of interest, though this is a more advanced technique.
Experimental Protocols
Protocol 1: Standardized Sample Preparation for SEM/EDX of Fatigued Encapsulation
- Cleaning: Sonicate the failed region in successive baths of deionized water and isopropanol for 60 seconds each. Dry in a desiccator for 2 hours.
- Cross-Sectioning (if required): Using a sharp ceramic blade, cleave the sample perpendicular to the crack. If using a resin, embed as per Q5 guidelines and polish with successive diamond suspensions (9 μm to 0.25 μm).
- Mounting: Secure the sample to an aluminum stub using conductive carbon tape. Bridge the sample surface to the stub with silver paint if necessary.
- Coating: Sputter-coat the sample with a 7 nm layer of Au/Pd in an argon atmosphere at 20 mA for 60 seconds.
- SEM/EDX Parameters:
- Accelerating Voltage: 5 kV (imaging), 15 kV (EDX)
- Working Distance: 10 mm
- Aperture Size: 30 μm
- EDX Live Time: 100 seconds, Process Time: 5
Protocol 2: Surface Profilometry for Fatigue Crack Depth and Roughness Analysis
- Sample Stabilization: Adhere the flexible film to a clean, flat glass slide using a minimal amount of double-sided tape to prevent buckling.
- Profiler Calibration: Calibrate the vertical (Z) axis using a certified step-height standard (e.g., 180 nm ± 5%).
- Scan Setup:
- Stylus Type: 2 μm radius diamond tip (for contact).
- Force: 0.5 mg.
- Scan Length: 1000 μm (encompassing the crack and intact regions).
- Speed: 50 μm/s.
- Data Points: 1000 per line scan.
- Measurement: Perform 5 parallel line scans spaced 20 μm apart across the crack. Save raw elevation data.
- Data Processing: Apply a polynomial form removal (order 2) to flatten the baseline. Use software algorithms to calculate Ra (average roughness) of the crack walls and maximum crack depth.
Data Presentation
Table 1: Typical EDX Elemental Weight Percentage at Different Fatigue Crack Locations
| Analysis Location | C (wt%) | O (wt%) | Si (wt%) | Al (wt%) | N (wt%) | Probable Assignment |
|---|---|---|---|---|---|---|
| Bulk Polymer | 78.5 ± 2.1 | 21.1 ± 1.8 | 0.2 ± 0.1 | 0.0 | 0.2 ± 0.1 | Base Polymer Matrix |
| Crack Interior | 65.3 ± 3.5 | 18.4 ± 2.5 | 8.5 ± 1.2 | 5.1 ± 0.8 | 2.7 ± 0.5 | Barrier Layer Debris |
| Crack Edge | 72.8 ± 1.9 | 23.5 ± 1.6 | 2.1 ± 0.4 | 1.2 ± 0.3 | 0.4 ± 0.2 | Contaminated Interface |
| Pristine Barrier | 5.2 ± 0.5 | 32.1 ± 1.2 | 45.3 ± 2.0 | 17.4 ± 1.0 | 0.0 | SiAlO_x_ Layer |
Table 2: Surface Profilometry Metrics from Cyclic Fatigue Testing
| Fatigue Cycles (k) | Avg. Crack Depth (nm) | Max Crack Depth (nm) | Crack Wall Roughness, Ra (nm) | Adjacent Surface Roughness, Ra (nm) |
|---|---|---|---|---|
| 0 (Control) | N/A | N/A | 15.2 ± 3.1 | 14.8 ± 2.9 |
| 10 | 120 ± 25 | 185 | 42.7 ± 8.4 | 18.9 ± 4.2 |
| 50 | 450 ± 65 | 720 | 89.5 ± 15.3 | 24.1 ± 5.6 |
| 100 | 980 ± 120 | 1550 | 132.4 ± 22.8 | 31.5 ± 7.1 |
Visualizations
Root Cause Analysis Workflow for Encapsulation Failure
Fatigue Failure Progression in Flexible Encapsulation
The Scientist's Toolkit: Research Reagent Solutions
Table 3: Essential Materials for Post-Failure Characterization
| Item | Function | Example Product/Specification |
|---|---|---|
| Conductive Carbon Tape | Provides both adhesion and electrical grounding for SEM samples, minimizing charging. | Double-sided, 12 mm width, carbon-filled adhesive. |
| Au/Pd Target for Sputter Coater | Creates a thin, uniform conductive coating on non-conductive polymer samples for high-quality SEM imaging. | 60/40 gold/palladium alloy, 2" diameter, 0.005" thickness. |
| Low-Viscosity Epoxy Embedding Resin | For preparing polished cross-sections without introducing artifacts at fragile crack interfaces. | Epofix Cold-Setting Resin (low viscosity: ~200 mPa.s). |
| Diamond Polishing Suspensions | Used in successive grades to create a scratch-free, artifact-free cross-sectional surface for SEM/EDX. | 9 μm, 3 μm, 1 μm, and 0.25 μm polycrystalline diamond suspensions in water-based lubricant. |
| Certified Profilometry Step Height Standard | Critical for daily calibration of the profilometer's vertical (Z-axis) measurement accuracy. | Silica step standard, 180 nm ± 5% height, traceable to NIST. |
| Non-Reactive Solvent for Cleaning | Removes surface contamination (oils, dust) without damaging the polymer substrate prior to analysis. | Electronic grade isopropanol, in an ultrasonic cleaning bath. |
| Conductive Silver Paint | Creates a high-conductivity bridge from the sample surface to the stub, further reducing charging. | Colloidal silver in organic solvent, fast-drying. |
Troubleshooting Guides & FAQs
Q1: During cyclic bend testing of my encapsulated flexible sensor, delamination consistently initiates at the corners. What are the primary causes and solutions? A: This is a classic edge effect stress concentration. Primary causes include: 1) Sharp, 90-degree corners acting as stress risers, 2) Poor adhesion at the interface due to contaminant or mismatch, 3) High modulus mismatch between encapsulant and substrate. Solutions: 1) Implement fillet geometries with a radius ≥ 5x the encapsulant thickness. 2) Use oxygen plasma or chemical primer (e.g., APTES for oxides, silanes for polymers) to improve adhesion. 3) Consider a graded modulus interlayer to soften the transition.
Q2: My fatigue test data shows high scatter when the encapsulation layer transitions from a rigid chip area to a flexible interconnect. How can I improve reliability at this geometric transition? A: Scatter indicates inconsistent stress distribution. Follow this protocol: 1) Design a tapered transition zone. The taper length (L) should follow: L > 10*(h2 - h1), where h2 and h1 are the thick and thin section heights. 2) Employ a compliant gradient material. Prepare a multi-layer spin-coat: start with a stiff polymer (e.g., PI, ~3 GPa), then sequential coats with increasing soft elastomer (e.g., PDMS) ratio. 3) Validate with local strain mapping using digital image correlation (DIC) during testing to optimize the taper profile.
Q3: Adhesion fails at the encapsulation-electrode interface under humidity/temperature cycling. What surface treatments or interlayers are most effective? A: Failure is likely due to hydrolytic degradation of the interface. The most robust solutions combine mechanical interlocking and chemical bonding:
- For Metal Electrodes (Au, Pt): Apply a molecular adhesive like (3-Mercaptopropyl)trimethoxysilane (MPTMS). Protocol: Clean metal in O2 plasma for 2 min, immerse in 1mM MPTMS/ethanol solution for 1 hour, rinse with ethanol, and cure at 110°C for 10 min before encapsulant application.
- For Oxide Surfaces (SiO2, ITO): Use (3-Aminopropyl)triethoxysilane (APTES) with a similar protocol.
- Universal Approach: Deposit a 50-200 nm thick organic-inorganic hybrid layer (e.g., ORMOCER) via spin-coating as an adhesion-promoting barrier.
Q4: How do I quantitatively compare the stress-concentrating effect of different edge designs? A: Use Finite Element Analysis (FEA) coupled with experimental validation. A standard comparative protocol:
- Model: Create 2D plane-strain FEA models of your encapsulation cross-section with different edge designs (sharp, chamfered, filleted).
- Simulate: Apply a standard bending displacement (e.g., 10mm radius). Extract the maximum principal stress at the critical interface.
- Calculate Stress Concentration Factor (Kt): Kt = σmax / σnom, where σ_nom is the stress in a region far from the discontinuity.
- Validate: Fabricate test samples and subject them to identical bending in a fixture while monitoring for crack initiation with a microscope.
Table 1: Stress Concentration Factors (Kt) for Common Edge Geometries
| Edge Geometry | Description | Approx. Kt (Bending) | Relative Fatigue Life |
|---|---|---|---|
| Sharp 90° Corner | No mitigation | 3.0 - 5.0 | 1x (Baseline) |
| Chamfer (45°) | Angled cut, 0.5t depth | 2.0 - 2.5 | ~5x |
| Fillet (Radius = t) | Rounded corner, r = encapsulant thickness | 1.8 - 2.2 | ~10x |
| Graded Fillet (Radius = 2t) + Taper | Large radius with tapered substrate | 1.2 - 1.5 | >50x |
Q5: What is a reliable lab-scale method to test adhesion energy (Gc) for thin-film encapsulation interfaces? A: The Double Cantilever Beam (DCB) test is optimal for measuring mode-I adhesion fracture toughness. Experimental Protocol:
- Sample Fabrication: Sandwich your encapsulant film between two flexible substrate "beams" (e.g., PI, 100µm thick). Leave a pre-crack (non-adhered region) at one end.
- Test Setup: Mount the sample in a tensile tester. Use piano hinges or blocks glued to the ends of each beam to apply peeling force.
- Procedure: Perform a constant displacement rate test (e.g., 0.5 mm/min). Record load (P) vs. displacement (δ).
- Calculation: Use the beam theory formula: Gc = (12*P^2 * a^2) / (E * b^2 * h^3), where P=load, a=crack length, E=substrate modulus, b=sample width, h=substrate thickness. Measure 'a' visually or via compliance calibration.
The Scientist's Toolkit: Research Reagent Solutions
| Item | Function & Rationale |
|---|---|
| Polydimethylsiloxane (PDMS), Sylgard 184 | A two-part silicone elastomer. Standard compliant encapsulant; tunable modulus (0.5-3 MPa) by varying base:curing agent ratio. |
| Polyimide (PI) Precursor (e.g., PI-2545) | High-temperature polyamic acid solution. Forms a rigid, chemically resistant, and thermally stable encapsulation or substrate layer. |
| (3-Aminopropyl)triethoxysilane (APTES) | Silane coupling agent. Promotes adhesion between oxide surfaces (SiO2, ITO) and organic encapsulants by forming covalent Si-O-M and -NH2 bonds. |
| Oxygen Plasma System | Surface activation tool. Cleans organic contaminants and creates hydroxyl (-OH) groups on polymer/oxide surfaces, dramatically increasing surface energy for better wetting and bonding. |
| Polyurethane-based Optical Adhesive (e.g., NOA 73) | UV-curable, moderate modulus (~100 MPa) adhesive. Useful as a stress-absorbing interlayer due to its toughness and good adhesion to many surfaces. |
| Fluorinated Silane (e.g., Tridecafluoro-1,1,2,2-tetrahydrooctyl trichlorosilane) | Low-surface-energy coating. Applied selectively to create "debond" regions for pre-cracks in adhesion tests or to control encapsulant spread. |
| Digital Image Correlation (DIC) System | Non-contact strain mapping. Critical for validating FEA models by measuring full-field displacement/strain on samples during mechanical testing. |
| Cyclic Flexure Tester (Custom or Commercial) | Applies controlled, repetitive bending. Essential for generating fatigue lifetime (S-N) curves for encapsulated devices under simulated use conditions. |
Workflow for Stress Concentration Mitigation
Stress Mitigation Pathways Diagram
Technical Support Center
Troubleshooting Guides & FAQs
Q1: My flexible encapsulation film exhibits cracking after cyclic strain testing. How can I adjust the formulation to improve fatigue resistance?
A: Cracking under cyclic load is a classic sign of mechanical fatigue. This can be addressed by balancing three formulation components:
- Reduce Crosslink Density: Excessively high crosslink density restricts polymer chain mobility, leading to brittle fracture. Consider reducing the crosslinker (e.g., dicumyl peroxide, HMDI) concentration by 0.1-0.3 wt%.
- Re-evaluate Plasticizer: Your plasticizer (e.g., DEHP, TOTM) may be migrating or insufficient. Consider switching to a polymeric plasticizer (e.g., polyadipates) for reduced migration. Increase plasticizer content incrementally by 2-5 phr, monitoring for weeping.
- Incorporate a Toughener: Introduce a core-shell impact modifier (e.g., MBS, acrylic-based) or nanofiller (e.g., cellulose nanocrystals at 0.5-2 wt%) to dissipate energy and blunt crack propagation.
See Table 1 for quantitative adjustments and the Workflow Diagram (Diagram 1).
Q2: I observe plasticizer exudation (weeping) from my film over time, which alters mechanical properties. How can I prevent this?
A: Exudation indicates plasticizer-polymer incompatibility or excessive concentration.
- Solution A: Replace low molecular weight plasticizers (e.g., DBP) with higher molecular weight or polymeric alternatives (e.g., DINCH, polymeric sebacates).
- Solution B: Increase crosslink density slightly to create a tighter network that entraps the plasticizer. A small increase (e.g., 0.05-0.1 wt% crosslinker) can help without drastically increasing modulus.
- Solution C: Use a plasticizer that has chemical similarity to your polymer matrix to improve compatibility.
Q3: My formulation achieves the desired elongation but has low tensile strength. How can I increase strength without sacrificing flexibility?
A: This is a core toughness optimization challenge.
- Strategy: Employ a dual-phase approach. Maintain sufficient plasticizer (e.g., 20-30 phr DOA) for chain mobility. Simultaneously, incorporate a dispersed toughening phase.
- Protocol: Blend with 5-15 wt% of a thermoplastic polyurethane (TPU) elastomer or 1-3 wt% of well-dispersed silica nanoparticles. These phases will bear load and increase strength while the plasticized matrix maintains elongation. Refer to Experiment Protocol 1.
Q4: How do I accurately measure the crosslink density of my cured polymer film for quality control?
A: The most common method is the equilibrium swelling experiment via the Flory-Rehner equation.
- Protocol: Weigh a dry sample (Wd). Immerse it in a good solvent (e.g., toluene for silicones, THF for acrylics) for 48hrs at 25°C. Blot and weigh the swollen sample (Ws). Dry to constant weight and re-weigh (Wr). Use the volume fraction of polymer in the swollen gel (v_r) in the Flory-Rehner equation to calculate crosslink density. See Experiment Protocol 2 for details.
Data Presentation
Table 1: Formulation Adjustments for Fatigue Resistance
| Issue | Primary Suspect | Recommended Adjustment | Expected Outcome | Key Risk |
|---|---|---|---|---|
| Brittle Cracking | Crosslink Density | Reduce peroxide by 0.2 wt% | ↑ Elongation at Break by ~40% | ↓ Creep Resistance |
| Plasticizer Weeping | Plasticizer MW/Content | Switch to polymeric plasticizer, +2 phr | ↑ Retention after aging >95% | ↑ Viscosity, harder processing |
| Low Toughness | Lack of Enhancer | Add 8 wt% MBS particles | ↑ Notched Impact Strength by 300% | Slight Haze (optical clarity loss) |
| Permanent Set | Low Crosslinking | Increase crosslinker by 0.1 wt% | ↑ Elastic Recovery by 15% | ↑ Modulus, ↓ Ultimate Elongation |
Experimental Protocols
Experiment Protocol 1: Incorporating TPU as a Toughening Phase Objective: To increase tensile strength and tear resistance without critically reducing elasticity. Materials: Base polymer (e.g., PVC or silicone), primary plasticizer, TPU pellets (e.g., polyester-based, 80A shore hardness). Method:
- Pre-mix base polymer with 25 phr plasticizer in an internal mixer at 60°C for 10 minutes.
- Gradually add TPU pellets at 10 wt% of the total batch mass. Increase temperature to 180°C (for compatible systems) and mix for 15-20 minutes until homogeneous.
- Compression mold at 180°C and 150 bar for 5 minutes. Cool under pressure.
- Characterize via ASTM D412 (tensile) and ASTM D624 (tear).
Experiment Protocol 2: Determining Crosslink Density by Swelling Objective: Quantify the effective crosslink density (ν) of a cured elastomer. Materials: Cured polymer sample (~0.5g), equilibrium solvent (toluene), sealed vials, analytical balance. Method:
- Dry sample thoroughly (Wd). Record weight.
- Immerse in excess solvent in a sealed vial at constant temperature (e.g., 25°C) for 48 hrs.
- Remove, quickly blot surface solvent, and weigh immediately (Ws).
- Dry sample in vacuum oven to constant weight (Wr).
- Calculate: Determine volume fraction of polymer vr = (Wr/ρpolymer) / [(Wr/ρpolymer) + ((Ws-Wr)/ρsolvent)].
- Apply Flory-Rehner equation for tetra-functional networks: ν = -[ln(1-vr) + vr + χ vr²] / [Vs * (vr^(1/3) - vr/2)], where V_s is solvent molar volume and χ is the Flory interaction parameter.
Mandatory Visualization
Diagram 1: Fatigue Failure Troubleshooting Workflow
Diagram 2: Component Roles in Polymer Network
The Scientist's Toolkit: Research Reagent Solutions
Table 2: Essential Materials for Formulation Optimization
| Material Category | Example Compounds | Primary Function | Key Consideration |
|---|---|---|---|
| Crosslinkers | Dicumyl peroxide, Hexamethylene diisocyanate (HMDI), Tetraethyl orthosilicate (TEOS) | Forms covalent bonds between polymer chains, creating a 3D network. Determines elastic recovery and set. | Concentration dictates density; type affects cure kinetics & biocompatibility. |
| Plasticizers | Dioctyl adipate (DOA), Trioctyl trimellitate (TOTM), Polypropylene glycol (PPG), Acetyl tributyl citrate (ATBC) | Reduces glass transition temperature (Tg), increases chain mobility & flexibility. Lowers modulus. | Molecular weight & compatibility critical to prevent migration (weeping). |
| Toughness Enhancers | Methyl methacrylate-butadiene-styrene (MBS) core-shell, Thermoplastic Polyurethane (TPU), Cellulose Nanocrystals (CNC), Fumed Silica | Absorbs and dissipates mechanical energy, deflects cracks, improves impact & tear strength. | Dispersion is key; can affect transparency and viscosity. |
| Matrix Polymers | Poly(vinyl chloride) (PVC), Silicone elastomers (PDMS), Polyurethanes (PU), Acrylics | The continuous phase providing the primary chemical & bulk physical properties. | Base chemistry dictates compatible additives and processing methods. |
| Solvents (for Testing) | Toluene, Tetrahydrofuran (THF), Cyclohexane | Used in equilibrium swelling tests to calculate crosslink density via Flory-Rehner. | Must be a "good solvent" for the polymer to achieve thermodynamic equilibrium swelling. |
Technical Support & Troubleshooting Center
This support center addresses common experimental challenges within the context of research on mechanical fatigue in flexible encapsulation for biomedical devices.
FAQs & Troubleshooting Guides
Q1: During cyclic bending tests of my encapsulated flexible OLED, the thin-film barrier delaminates. What surface treatment should I prioritize to improve adhesion under fatigue?
A: This is a classic mechanical fatigue failure at the interface. Prioritize a plasma treatment of your substrate (e.g., PET, PI). The issue is likely insufficient surface energy for wetting and chemical bonding.
- Protocol: Use an oxygen or argon-oxygen plasma. Typical parameters: Power: 100-300 W, Time: 30-120 seconds, Pressure: 0.2-0.5 mbar. Immediately proceed with film deposition (<10 min delay) to prevent hydrophobic recovery.
- Troubleshooting: If delamination persists, measure water contact angle post-treatment. Aim for <10° reduction. If insufficient, increase treatment time/power incrementally, but avoid substrate etching which can create weak boundary layers.
Q2: My primer layer (e.g., silane-based) shows poor uniformity when spin-coated onto a plasma-treated flexible substrate, leading to localized adhesion failure. How can I improve coating quality?
A: Non-uniformity often stems from inconsistent surface wetting or solvent evaporation.
- Protocol (Revised Spin-Coating for Primers):
- Solution Filtering: Always filter the primer solution (0.2 µm PTFE filter) before coating.
- Static Dispense: Dispense primer onto stationary substrate.
- Spread Cycle: 500 rpm for 5-10 seconds to spread the solution evenly.
- Spin Cycle: 3000 rpm for 30-45 seconds to achieve target thickness.
- Soft Bake: Immediately bake on a hotplate at 90-110°C for 1 minute to remove solvent without premature curing.
- Troubleshooting: If "comet tails" or streaks persist, increase the spread cycle time. Ensure the lab environment has controlled humidity (<40% RH is ideal).
Q3: When designing an inorganic/organic interlayer for a fatigue-resistant barrier, what quantitative metrics should I track to predict adhesion performance?
A: Adhesion under fatigue is multi-faceted. Track these key parameters as predictors:
Table: Key Quantitative Metrics for Interlayer Adhesion Design
| Metric | Target Range | Measurement Technique | Rationale in Fatigue Context |
|---|---|---|---|
| Interfacial Toughness (Gc) | > 5 J/m² | Double Cantilever Beam (DCB) or 4-Point Bend | Direct measure of energy required to propagate a delamination crack. |
| Critical Strain to Failure | > 2% (for flexible apps.) | In-situ tensile testing with microscopy | Indicates the strain level where interface cracking initiates. |
| Surface Roughness (Ra) | 1-10 nm (optimal for mech. interlock) | Atomic Force Microscopy (AFM) | Moderate roughness enhances mechanical interlocking without creating stress concentrators. |
| Residual Stress (σ) | As low as possible (<100 MPa compressive) | Wafer Curvature (Stoney's Eq.) | High residual stress provides a driving force for delamination under cyclic loading. |
Q4: After depositing a metal oxide barrier layer (e.g., Al₂O₃ via ALD) on my primed polymer, the film passes initial tape tests but fails after 10,000 bending cycles. Is this an adhesion or a bulk film problem?
A: This is likely an interface fatigue problem. The primer-barrier interface may be chemically sound but mechanically mismatched.
- Diagnostic Experiment: Perform a Scanning Acoustic Microscopy (SAM) or cross-sectional FIB/SEM analysis before and after cycling. Look for micro-cracks or nano-delamination at the interface that weren't present initially.
- Solution: Implement a graded interlayer. Instead of a single primer, design a stack where the mechanical properties (modulus, hardness) transition gradually from the polymer to the ceramic barrier.
- Example Workflow: Polymer Substrate -> Plasma -> Soft Organic Primer (e.g., acrylic) -> Hybrid Organic-Inorganic Nanocomposite Layer -> Inorganic ALD Barrier.
Experimental Protocols from Cited Research
Protocol: 4-Point Bend Test for Interfacial Fracture Toughness (Gc) on Flexible Stacks This method is critical for quantifying adhesion relevant to bending fatigue.
- Sample Fabrication: Deposit your full thin-film stack (Substrate/Primer/Barrier) onto a rigid silicon carrier wafer. Use a release layer if necessary.
- Notching: Using a diamond saw or laser, create a pre-crack through the barrier layer and stop at the interface of interest.
- Bonding: Epoxy a rigid beam (glass or steel) of known thickness and modulus to the top surface of the barrier film.
- Testing: Load the sample in a 4-point bend fixture with the pre-crack aligned. The outer span is typically 40mm, inner span 20mm.
- Data Analysis: Record the load at which the crack propagates. Calculate Gc using the equation: Gc = [21 * P² * L² * (1 - ν²)] / [16 * E * b² * h³] where P=critical load, L=outer span, E & ν=substrate modulus & Poisson's ratio, b=sample width, h=sample thickness.
Protocol: Plasma Surface Energy Enhancement & Characterization
- Pre-Treatment Clean: Sonicate substrate in isopropanol for 10 minutes, dry with N₂.
- Baseline Measurement: Measure static water contact angle (WCA) using a goniometer.
- Plasma Treatment: Load sample into chamber. Evacuate to base pressure (<0.1 mbar). Introduce O₂ gas at 20 sccm. Set RF power to 150 W. Treat for 60 seconds.
- Post-Treatment: Vent chamber and remove sample. Measure WCA within 5 minutes. A successful treatment shows a WCA reduction of 20° or more.
- XPS Verification (Optional): Perform X-ray Photoelectron Spectroscopy (XPS) to confirm increase in C-O and C=O bonds at the surface, indicating activation.
Visualizations
Decision Workflow for Adhesion Fatigue Issues
Graded Interlayer Design for Stress Relief
The Scientist's Toolkit: Research Reagent Solutions
Table: Essential Materials for Thin-Film Adhesion & Fatigue Research
| Material / Reagent | Function & Rationale | Example Product/Type |
|---|---|---|
| Oxygen Plasma | Increases surface energy via oxidation and microroughness; essential for polymer activation. | Diener Electronic Femto, Harrick Plasma Cleaner. |
| (3-Aminopropyl)triethoxysilane (APTES) | Silane coupling primer; forms -NH₂ groups for covalent bonding with subsequent inorganic layers. | Sigma-Aldrich 440140, ≥98% purity. |
| UV-Ozone Cleaner | Alternative to plasma for mild surface cleaning and activation; generates atomic oxygen. | Novascan PSD Series. |
| Polymerizable Acrylic Primer | Forms a compliant, cross-linked organic layer to absorb strain and improve interlocking. | Mitsui Chemicals OPSTAR series. |
| Atomic Layer Deposition (ALD) Precursors | For depositing ultra-conformal, dense inorganic barrier layers (e.g., Al₂O₃). | Trimethylaluminum (TMA) for Al₂O₃, Tris(dimethylamino)silane for SiNx. |
| Polyimide Substrate | High-temperature, chemically stable flexible substrate for demanding encapsulation applications. | DuPont Kapton HN, UBE UPILEX. |
| Strain-Jagging Nanoparticles | Additives for graded interlayers; SiO₂ or Al₂O₃ nanoparticles modify modulus and deflect micro-cracks. | Nanosys colloidal dispersions. |
| Fluorinated Polyurethane Elastomer | Used as a stress-relieving top coat or interlayer in extreme flexing applications. | Merck Lisicon products. |
Technical Support Center: Fatigue & Encapsulation Troubleshooting Hub
FAQs & Troubleshooting Guides
Q1: During accelerated fatigue testing, my flexible Parylene C encapsulation layer is developing micro-cracks after only 50,000 bending cycles, far below the target of 10 million. What could be the cause? A: This premature failure is often linked to stress concentrators. Common culprits include:
- Sharp Device Edges: The underlying silicon or metal components have sharp transitions.
- Poor Interlayer Adhesion: Inadequate surface treatment between polymer and metal layers leads to delamination, initiating cracks.
- Solution: Implement finite element analysis (FEA) to model stress distribution. Redesign device geometry to use smooth, rounded contours. Introduce an adhesion promoter like A-174 silane and validate with tape tests (ASTM D3359).
Q2: My in vivo electrochemical impedance spectroscopy (EIS) data from a flexible probe shows a gradual increase in low-frequency impedance over 4 weeks, suggesting encapsulation failure. How can I confirm and locate the breach? A: A rising impedance at low frequencies (<100 Hz) is indicative of fluid ingress and biofouling.
- Confirmation Protocol:
- Post-explanation Inspection: Use scanning electron microscopy (SEM) at 5-10 kV to survey the device surface for micro-cracks or delamination.
- Focused Ion Beam (FIB) Milling: Cross-section suspect areas identified by SEM to examine internal layer integrity.
- Leak Test: Submerge the explanted device in a 0.9% NaCl solution heated to 70°C for 24 hours, then perform EIS again. A dramatic impedance drop confirms a major breach.
Q3: What is the most relevant accelerated testing protocol to simulate years of physiological cycling in a subcutaneous drug delivery pump? A: A multi-axis protocol is recommended to replicate complex in vivo motion (e.g., muscle flexion, respiration).
- Standardized Protocol:
- Fixture: Use a custom mandrel or actuator that combines bending and stretching.
- Parameters:
- Frequency: 2 Hz (approximates moderate physical activity).
- Strain: 5-15% (based on implant location simulation).
- Environment: Phosphate-buffered saline (PBS) at 37°C, pH 7.4.
- Endpoint Monitoring: Perform intermittent EIS and cyclic voltammetry every 50,000 cycles. Device failure is defined as a >90% change in baseline impedance or a visible leak of contained fluid (e.g., dye).
Q4: Are there quantitative benchmarks for acceptable water vapor transmission rates (WVTR) in flexible polymeric encapsulants for chronic implants? A: Yes, extremely low WVTR is critical to protect sensitive electronics. Targets are derived from semiconductor and display encapsulation research.
Table 1: Benchmark Water Vapor Transmission Rates (WVTR) for Chronic Encapsulation
| Material / Barrier Stack | Target WVTR (g/m²/day) | Typical Thickness | Test Standard |
|---|---|---|---|
| Single-layer Parylene C | ~0.1 - 1.0 | 10-20 µm | ASTM F1249 |
| Parylene C + SiO₂ bilayer | < 0.01 | (5 µm Parylene + 50 nm SiO₂) | ASTM F1249 |
| ALD Al₂O₃ on Polyimide | < 10⁻⁴ | 25 nm Al₂O₃ | MOCON / Ca Test |
| Ideal Hermetic Standard | < 10⁻⁶ | N/A | N/A |
Experimental Protocol: Ca Film Degradation Test for Ultra-low WVTR Measurement.
- Substrate Preparation: Clean a glass slide. Deposit a 100 nm Ca sensor layer via thermal evaporation through a shadow mask, creating a defined square.
- Barrier Deposition: Deposit the test polymeric or multi-layer barrier uniformly over the entire slide.
- Testing & Analysis: Place the sample in an 85°C/85%RH chamber. Monitor the optical transparency of the Ca square. The time for the Ca to fully oxidize (become transparent) is used to calculate the WVTR via established models.
Q5: Which signaling pathways are most relevant to the foreign body response (FBR) that induces mechanical stress on implants, and what are key therapeutic targets? A: The FBR is a primary driver of mechanical strain on encapsulation.
Diagram Title: Foreign Body Response Pathway & Therapeutic Targets
The Scientist's Toolkit: Key Research Reagent Solutions
Table 2: Essential Materials for Flexible Encapsulation Fatigue Research
| Item Name | Supplier Examples | Function & Application Notes |
|---|---|---|
| Parylene C | Specialty Coating Systems, Para Tech | Gold-standard polymer for conformal, biocompatible encapsulation. Low WVTR, but prone to cracking. Used as a control or base layer. |
| Polyimide (PI-2611) | HD MicroSystems | High-temperature, mechanically robust substrate/flexible layer. Excellent dielectric properties, moderate moisture absorption. |
| ALD Al₂O₃ Precursor (TMA) | Sigma-Aldrich, Forge Nano | Used in atomic layer deposition to create ultra-thin, conformal inorganic barrier layers on flexible polymers to drastically reduce WVTR. |
| A-174 Silane (γ-MPS) | Gelest, Sigma-Aldrich | Adhesion promoter. Forms chemical bonds between oxide layers (e.g., SiO₂) and polymer surfaces, critical for multilayer stack integrity. |
| Flexible Substrate Strain Tester | Instron, CellScale | Electro-mechanical system to apply cyclic bending/tensile strain to devices in liquid environments for accelerated lifetime testing. |
| Fluorescent Dextran (e.g., 70 kDa FITC-Dextran) | Thermo Fisher | Used as a simulated drug or tracer for leak testing. Visual or spectroscopic detection confirms encapsulation breach in fluid reservoirs. |
| PDMS (Sylgard 184) | Dow Inc. | Used to create soft, elastic mandrels for controlled bending tests or to simulate soft tissue environments in ex vivo setups. |
Benchmarking Performance: Validation Standards and Comparative Analysis of Encapsulation Strategies
Troubleshooting Guides & FAQs
Q1: Our accelerated fatigue tester shows high data scatter in cyclic loading of flexible encapsulation samples. What are the primary causes and corrective actions?
A: High scatter often stems from improper sample mounting, inconsistent environmental chamber conditions, or material batch variability.
- Action 1: Verify and standardize the clamping force and alignment using a torque wrench and alignment jigs.
- Action 2: Monitor and log chamber temperature and humidity at the sample location, not just the set point. Ensure samples are equilibrated before testing.
- Action 3: Characterize the storage modulus (DMA) and thickness of each sample batch as a quality control pre-check.
Q2: When fitting our lab degradation data (e.g., crack propagation rate) to an Arrhenius or power-law model, the extrapolation to in vivo conditions yields unrealistically short or long lifetimes. How can we improve the model's predictive power?
A: This indicates missing failure mechanisms or incorrect acceleration factors.
- Action 1: Perform post-mortem analysis (SEM/EDX) on lab-tested samples and compare with explanted devices to confirm failure mode relevance.
- Action 2: Incorporate a multi-stress model (e.g., Taylor's model) that combines thermal, mechanical, and hygroscopic stresses. Calibrate coefficients from a designed experiment (DOE) with at least three stress levels per factor.
- Action 3: Validate the model against intermediate-term in vivo data (e.g., 6-month animal study) before full-service life extrapolation.
Q3: Our optical strain measurement (Digital Image Correlation) on thin encapsulation films during fatigue testing is noisy. How can we improve signal quality?
A: Noise arises from poor speckle pattern, lighting glare, or insufficient camera resolution.
- Action 1: Apply a high-contrast, flexible speckle pattern using an airbrush with matte white paint and then matte black paint. Ensure particle size is 3-5 pixels.
- Action 2: Use polarized light filters on both lights and the camera lens to eliminate glare from moist or polymer surfaces.
- Action 3: Calibrate the system using a calibration plate with a grid spacing an order of magnitude smaller than your feature of interest (e.g., expected crack length).
Q4: How do we account for the effect of dynamic bodily fluids (e.g., synovial fluid, interstitial fluid) on fatigue life in a static lab immersion test?
A: Static immersion misses chemical replenishment and pressure cycling.
- Protocol: Establish a bioreactor test rig that cycles both mechanical strain and fluid flow/pressure. Use a physiologically relevant fluid (e.g., PBS with 10% fetal bovine serum, maintained at 37°C, pH 7.4). Flow rate should match the target tissue's perfusion rate (see table below).
Table 1: Typical Acceleration Factors for Flexible Encapsulation Materials
| Stressor | Accelerated Lab Condition | In Vivo Condition | Acceleration Factor (Approx.) | Key Model Parameter |
|---|---|---|---|---|
| Temperature | 85°C | 37°C (body) | 8-12x (Q₁₀=2) | Activation Energy (Eₐ) ~ 0.7 eV |
| Mechanical Strain | 15-25% strain amplitude | 2-8% strain amplitude | 50-200x | Power Law Exponent (n) ~ 4-6 |
| Hydration | 85% RH or direct immersion | Variable tissue hydration | 3-10x | Diffusion Coefficient (D) ~ 1e-7 cm²/s |
Table 2: Key Material Properties for Model Input
| Property | Test Standard | Typical Value (PDMS) | Typical Value (Polyurethane) | Relevance to Model |
|---|---|---|---|---|
| Storage Modulus (E') | ISO 6721-1 (DMA) | 1-3 MPa | 50-200 MPa | Stress calculation |
| Crack Initiation Energy (G_c) | ASTM D624 (Tear) | 1000-5000 J/m² | 5000-20,000 J/m² | Paris' Law for propagation |
| Water Vapor Transmission Rate (WVTR) | ASTM E96 | 10-20 g·mil/(m²·day) | 1-5 g·mil/(m²·day) | Hydration-driven degradation |
Experimental Protocols
Protocol 1: Biaxial Accelerated Fatigue Test with Environmental Control
- Objective: Generate crack propagation rate (da/dN) data under combined thermal-humidity-mechanical stress.
- Materials: See "Scientist's Toolkit" below.
- Procedure:
- Mount preconditioned (24h at test RH) film sample in biaxial fixture.
- Seal sample within environmental chamber. Ramp to 60°C, 85% RH. Hold for 1-hour equilibration.
- Apply sinusoidal biaxial strain (10-20% amplitude, 1-5 Hz frequency). Monitor force relaxation.
- Use in-situ microscope (every 10k cycles) to measure crack length (≥3 replicates).
- Continue until sample failure or 10 million cycles.
- Fit da/dN vs. Strain Energy Release Rate (ΔG) data to Paris' Law: da/dN = C(ΔG)^m.
Protocol 2: Ex Vivo Validation of Degradation Mode
- Objective: Confirm lab-observed failure modes match in vivo modes.
- Procedure:
- Implant encapsulated sensor prototypes in subcutaneous rat model (IACUC approved).
- Explain devices at 1, 3, and 6-month intervals (n=4 per interval).
- Clean explants in deionized water. Analyze using:
- Micro-CT for bulk crack/delamination.
- SEM/EDX on critical regions for surface cracking and element analysis (e.g., Ca, P deposition).
- ATR-FTIR for polymer chain scission or oxidation.
- Statistically compare feature prevalence (e.g., crack density) with lab-tested samples using a two-sample t-test.
Visualizations
Diagram 1: Predictive Lifetime Modeling Workflow
Diagram 2: Multi-Stress Acceleration Model
The Scientist's Toolkit: Key Research Reagent Solutions
| Item | Function in Experiment | Example/Specification |
|---|---|---|
| Biaxial Fatigue Tester | Applies controlled, cyclic multi-axial strain to mimic in vivo loading. | Electroforce/Bose Planar Biaxial System with environmental chamber. |
| Digital Image Correlation (DIC) System | Non-contact, full-field strain and displacement mapping on film surfaces. | 5MP monochrome cameras, matte speckle kit, software (e.g., GOM Correlate). |
| Dynamic Mechanical Analyzer (DMA) | Measures viscoelastic properties (E', E'', tan δ) under temperature & frequency sweeps. | TA Instruments Q800, film tension clamp. |
| Physiological Solution | Simulates chemical environment of bodily fluids for immersion testing. | Phosphate-Buffered Saline (PBS), pH 7.4, with 0.1% Sodium Azide. |
| Barrier Film Sample (PDMS) | Model flexible encapsulation material for method development. | Sylgard 184, 100-500 µm thickness, characterized for modulus and WVTR. |
| Environmental Chamber | Controls temperature and humidity around sample during mechanical test. | Humidity range 20-95% RH, temperature range 20-100°C. |
| High-Resolution Microscope | In-situ or ex-situ crack initiation and propagation measurement. | Keyence VHX Series with 20x-200x magnification. |
Troubleshooting Guides & FAQs
Q1: During cyclic bending tests, our encapsulated device layer shows premature delamination. What are the primary causes and solutions?
A: Premature delamination under cyclic loading typically indicates adhesion fatigue or a coefficient of thermal expansion (CTE) mismatch. First, verify substrate surface pretreatment. For polymers like PDMS, a 60-second oxygen plasma treatment at 100W is essential. For inorganic substrates, consider a silane coupling agent (e.g., (3-Aminopropyl)triethoxysilane, APTES). If the issue persists, measure the storage modulus (E') of your encapsulant via Dynamic Mechanical Analysis (DMA). A rapid drop in E' above the glass transition temperature (Tg) can lead to stress concentration at interfaces. Switch to an encapsulant with a higher crosslink density or a graded modulus interlayer.
Q2: We observe a significant drop in barrier performance (water vapor transmission rate, WVTR) after 10,000 flex cycles. Is this due to microcrack formation or material property degradation?
A: This is characteristic of fatigue-induced microcracking. To diagnose, perform post-cycling optical microscopy with fluorescent dye (e.g., Rhodamine B) penetrant. A web-like pattern indicates cohesive fatigue cracks within the encapsulant bulk. A pattern only at the device edges suggests interfacial crack initiation. Solution: Incorporate a flexible, nanoparticle-reinforced composite barrier layer (e.g., ALD Al2O3 nanoparticles in polyurethane) to deflect and bridge microcracks. Ensure nanoparticles are uniformly dispersed (<5% agglomeration) via sonication.
Q3: Our in-house synthesized polyimide encapsulant shows good initial flexibility but becomes brittle and yellows after 500 hours of accelerated aging (85°C/85%RH). What is the mechanism?
A: This points to hydrolytic and thermo-oxidative degradation, common in polyimides with ester or carbonyl groups in the backbone. The yellowing is due to the formation of chromophoric groups. Perform Fourier-Transform Infrared Spectroscopy (FTIR) post-aging to identify new carbonyl peaks (1680-1720 cm⁻¹). Mitigation Protocol: 1) Synthesize with aliphatic or fluorinated diamines to reduce moisture absorption. 2) Add a UV-stabilizer (Hindered Amine Light Stabilizer, HALS, at 0.5-1.0 wt%) and an antioxidant (e.g., Irganox 1010, 0.3 wt%) during resin formulation.
Q4: When comparing commercial silicone to research-grade Parylene C, how do we standardize fatigue test parameters for a fair comparison?
A: Standardization is critical due to vastly different material properties. Adopt a strain-based, not force-based, testing regimen.
- Sample Prep: Use identical substrates (e.g., 125μm thick PET).
- Strain Calculation: Set your cyclic bending tester radius (R) to impose a consistent maximum surface strain: ε = d / (2R) * 100%, where d is total sample thickness. Use ε = 1% as a standard high-cycle fatigue starting point.
- Frequency: Keep frequency low (≤1 Hz) to minimize hysteretic heating, especially for silicones.
- Failure Criterion: Define a common electrical (e.g., open circuit) or optical (visible crack under 40x magnification) failure endpoint.
Table 1: Fatigue Performance of Selected Encapsulants Under Cyclic Bending (ε = 1.5%, 1 Hz)
| Encapsulant (Type) | Thickness (µm) | Avg. Cycles to Failure (N_f) | Failure Mode (Primary) | WVTR Post-10k cycles (g/m²/day) |
|---|---|---|---|---|
| Commercial Silicone (PDMS) | 100 | >1,000,000 | Interfacial Delamination | 8.5 (from 5.2 initial) |
| Commercial Polyurethane | 50 | ~250,000 | Cohesive Cracking | 12.1 (from 1.5 initial) |
| Parylene C (CVD) | 20 | ~50,000 | Brittle Fracture | 0.01 (no change) |
| Research-Grade HNBR Composite | 75 | ~550,000 | Minimal Crack Growth | 0.8 (from 0.5 initial) |
| Spin-On Glass Hybrid | 10 | ~20,000 | Channeling Cracks | 0.05 (to 0.15) |
Table 2: Key Material Properties Relevant to Fatigue
| Material | Storage Modulus, E' @ 25°C (MPa) | Glass Transition Temp, Tg (°C) | CTE (ppm/°C) | Critical Strain Energy Release Rate, G1c (J/m²) |
|---|---|---|---|---|
| PDMS (Sylgard 184) | 2.1 | -125 | 310 | ~100 |
| Polyurethane (PTK/F) | 250 | -30 | 180 | ~5000 |
| Parylene C | 3200 | 80-90 | 35 | ~50 |
| Polyimide (PI-2611) | 2900 | >350 | 45 | ~80 |
| Epoxy (SU-8 3050) | 4500 | >200 | 52 | ~25 |
Experimental Protocols
Protocol 1: Accelerated Fatigue Testing via Cyclic Bending Objective: Determine the number of cycles to failure (N_f) for an encapsulant on a flexible substrate.
- Sample Preparation: Deposit/laminate encapsulant onto a clean, standardized flexible substrate (e.g., 125µm PET). Define a test coupon size (e.g., 10cm x 2cm).
- Instrument Setup: Mount sample in a custom or commercial cyclic bending tester (e.g., with mandrel or dual-axis stage). Connect in-situ resistance monitoring for encapsulated metal trace, if applicable.
- Parameter Setting: Set bending radius (R) to achieve desired tensile strain (ε) on the encapsulant surface using the formula ε = d/(2R), where d is total thickness. Typical R values range from 5mm to 20mm. Set frequency to 0.5-1 Hz. Ambient conditions: 23°C, 50% RH.
- Execution & Monitoring: Initiate cycling. Record the cycle count when electrical continuity is lost or when visual inspection (pre-programmed pauses every 5k cycles) reveals first visible crack via microscope.
- Analysis: Plot survival rate vs. cycle count. Calculate mean and standard deviation of N_f for n≥5 samples.
Protocol 2: Post-Fatigue Barrier Integrity Assessment (Calcium Test) Objective: Quantify water vapor transmission rate (WVTR) degradation after flexural fatigue.
- Sensor Fabrication: Thermally evaporate a 100nm thick calcium (Ca) layer onto a glass slide, patterned into 5mm x 5mm squares.
- Encapsulation & Fatigue: Encapsulate the Ca sensor with the test material using your standard process. Subject the encapsulated sensor to a predefined number of flex cycles (e.g., 0, 1k, 10k, 100k).
- Optical Measurement: Place the sample in a controlled humidity chamber (85% RH, 25°C). Use an optical microscope to capture images of the Ca squares every 15 minutes. Metallic Ca becomes transparent Ca(OH)₂ upon reaction with water vapor.
- Data Calculation: Use image analysis software to quantify the percentage of transparent area over time. Calculate WVTR using the known stoichiometry of the reaction and the Ca film geometry.
The Scientist's Toolkit: Research Reagent Solutions
| Item | Function & Rationale |
|---|---|
| Sylgard 184 (PDMS) | A commercial two-part silicone elastomer. Serves as a baseline flexible, low-modulus encapsulant. Its high permeability makes it a good control for interfacial adhesion fatigue studies. |
| Parylene C (Dix-C) | A vapor-deposited polymer providing exceptional conformality and barrier properties. Used as a benchmark for thin-film, brittle encapsulation failure modes (crack propagation studies). |
| APTES (Silane Coupler) | (3-Aminopropyl)triethoxysilane. Forms a covalent bond between inorganic substrates (SiO2, metals) and organic encapsulants, crucial for improving interfacial adhesion fatigue life. |
| HXNBR Latex | Hydrogenated Carboxylated Nitrile Butadiene Rubber. A research-grade elastomer with excellent fatigue crack growth resistance and moderate barrier properties, used in composite formulations. |
| ALD Al2O3 Nanoparticles | Atomic Layer Deposited alumina nanoparticles (~30nm). Used as fillers in polymer matrices to create tortuous paths for diffusing species, improving barrier performance and hindering microcrack growth. |
| Fluorescent Dye (Rhodamine B) | A penetrant dye for visualizing microcracks and delamination paths under fluorescence microscopy post-fatigue testing. |
| Cyclic Bending Tester | A programmable mechanical fixture (e.g., from Instron or custom-built) to apply precise, repeated bending strains for high-cycle fatigue characterization. |
Visualizations
Diagram Title: Experimental Workflow for Encapsulant Fatigue Analysis
Diagram Title: Fatigue Failure Pathways in Flexible Encapsulants
Technical Support Center
Troubleshooting Guides & FAQs
Q1: We are observing premature cracking of our polymer encapsulation film during cyclic strain testing in simulated intestinal fluid (SIF). What could be the cause? A: This is a common fatigue failure mode. Likely causes and solutions:
- Cause 1: Plasticization by Surfactants. Bile salts (e.g., sodium taurocholate) in SIF can act as plasticizers, reducing the polymer's glass transition temperature (Tg) and modulus, making it more susceptible to creep and fatigue.
- Solution: Pre-soak samples in SIF for 24h prior to strain testing to reach equilibrium swelling. Characterize Tg post-soak via DSC.
- Cause 2: Stress Corrosion Cracking. The combined action of tensile stress and an aggressive fluid (e.g., Fed-State Simulated Intestinal Fluid, FeSSIF) accelerates crack propagation.
- Solution: Run parallel control experiments in deionized water under identical strain. Compare crack propagation rates (see Table 1).
- Cause 3: Inadequate Adhesion at Interface. Dynamic strain can delaminate the coating from the underlying flexible substrate.
- Solution: Implement a plasma or chemical surface treatment protocol for the substrate prior to polymer deposition to enhance adhesion energy.
Q2: Our drug release profile in a flow-through dissolution apparatus under peristaltic strain does not match static incubation data. How should we debug this? A: Dynamic strain alters mass transport and film integrity. Follow this debug protocol:
- Verify Strain Parameters: Confirm the applied strain amplitude and frequency match in vivo values for the target tissue (e.g., 10-30% strain at 0.1-0.2 Hz for intestinal peristalsis).
- Inspect for Microscopic Damage: Use scanning electron microscopy (SEM) on post-test films to identify micro-cracks not visible to the naked eye.
- Check for Syneresis: Under cyclic compression, hydrogel-based encapsulants may expel pore fluid (syneresis), altering local drug concentration and diffusion rates. Measure hydrogel mass before/after dynamic testing.
- Validate Flow Rate: Ensure the flow rate of the biorelevant fluid (e.g., 2-10 mL/min for simulated gastric emptying) is calibrated and consistent.
Q3: How do we select the most appropriate simulated body fluid for a gastric retention device test? A: The choice is critical and depends on fed/fast state and intended duration. See Table 2 for standard compositions. For long-term gastric residence (>12h), consider:
- Use of Enzymes: Incorporate pepsin (in SGF) and gastric lipase if lipid layers are present.
- pH Cycling: Mimic the diurnal cycle by cycling between fasting pH (~1.5-2) and postprandial pH (~4-5) every 4-6 hours.
- Mucin Addition: Add purified gastric mucin (e.g., 0.5-1% w/v) to study bioadhesion and mucosal barrier interactions.
Data Presentation
Table 1: Crack Propagation Rates in Different Media Under 20% Cyclic Strain
| Polymer Type | Medium (37°C) | Crack Growth Rate (µm/cycle) | Cycles to Failure | Key Mechanism |
|---|---|---|---|---|
| Poly(L-lactide) (PLLA) | Phosphate Buffer (pH 6.8) | 0.05 ± 0.01 | 15,200 | Fatigue |
| Poly(L-lactide) (PLLA) | Fasted State SIF (FaSSIF) | 0.18 ± 0.03 | 4,150 | Stress corrosion |
| Polyurethane (hydrophilic) | Deionized Water | 0.12 ± 0.02 | 8,450 | Hydrolytic softening |
| Polyurethane (hydrophilic) | Fed State SIF (FeSSIF) | 0.45 ± 0.07 | 2,100 | Plasticization + Fatigue |
| Silicone (PDMS) | Simulated Gastric Fluid (pH 1.2) | <0.01 | >50,000 | Chemically inert |
Table 2: Common Simulated Body Fluid Formulations
| Fluid | Acronym | Key Components (Typical Conc.) | pH | Typical Use Case |
|---|---|---|---|---|
| Simulated Gastric Fluid | SGF | Pepsin (0.1% w/v), NaCl, HCl | 1.2 | Gastric release (fasted) |
| Fasted State SIF | FaSSIF | Sodium taurocholate (3 mM), Lecithin (0.75 mM), KH₂PO₄, NaOH | 6.5 | Small intestine (fasted) |
| Fed State SIF | FeSSIF | Sodium taurocholate (15 mM), Lecithin (3.75 mM), Acetic acid, NaOH | 5.0 | Small intestine (fed) |
| Simulated Colonic Fluid | SCF | KH₂PO₄, Bacteria (e.g., B. ovatus), Resazurin | 6.8-7.2 | Colonic targeting |
Experimental Protocols
Protocol: Combined Dynamic Strain and Fluid Immersion Fatigue Test Objective: To evaluate the mechanical integrity of a flexible encapsulation film under biorelevant cyclic strain and fluid exposure. Materials: Biaxial tensile tester with fluid bath, simulated body fluid, film samples (e.g., 20mm x 20mm), environmental chamber. Procedure:
- Mounting: Securely clamp the sample in the tester's biocompatible grips. Submerge the sample in the pre-warmed (37°C) fluid bath.
- Pre-soak (Optional): For equilibrium swelling studies, hold at 0% strain for 24 hours.
- Strain Profile Programming: Program a sinusoidal strain waveform. Example: 15% amplitude, 0.15 Hz frequency (simulating intestinal contractions).
- Testing: Initiate cyclic straining. Monitor force decay (stress relaxation) over time.
- Failure Detection: Use a camera for visual crack detection or define failure as a 50% drop in initial peak tensile force.
- Post-analysis: Remove sample. Analyze for molecular weight change (GPC), thermal properties (DSC), and surface morphology (SEM).
Protocol: Drug Release Under Peristaltic Mimicry Objective: To quantify drug release from an encapsulated system under simulated peristaltic movement. Materials: USP Apparatus 4 (Flow-through cell) with a modified cell capable of radial compression, peristaltic pump, biorelevant medium, HPLC system. Procedure:
- Apparatus Setup: Place the flexible capsule or film in the modified flow-through cell. Connect the cell to a system that applies periodic radial compression (e.g., via pneumatic actuators).
- Conditioning: Flush the system with medium at 37°C for 15 minutes without compression.
- Dynamic Run: Start the peristaltic pump for continuous flow (e.g., 8 mL/min). Simultaneously, initiate the compression cycle (e.g., 20% radial compression, 12 cycles per minute).
- Sampling: Collect eluent fractions at predetermined time points.
- Analysis: Quantify drug content in each fraction via HPLC. Compare release profile against a static control.
Mandatory Visualizations
Title: Combined Fluid & Strain Fatigue Test Workflow
Title: Fatigue Failure Mechanisms & Outcomes
The Scientist's Toolkit: Research Reagent Solutions
| Item | Function in Experiment | Key Consideration |
|---|---|---|
| Sodium Taurocholate | Primary bile salt in FaSSIF/FeSSIF. Mimics lipid solubilization and plasticization effects. | High purity (>97%). Store desiccated, protect from light. |
| 1,2-Dioleoyl-sn-glycero-3-phosphocholine (DOPC) | Phospholipid component of simulated fluids. Affects wetting and fluid penetration into polymers. | Use fresh liposome suspensions; sonicate to achieve uniform size. |
| Pepsin (from porcine gastric mucosa) | Proteolytic enzyme in SGF. Tests enzyme-mediated degradation of protein-based encapsulants. | Activity can vary between lots; standardize activity (e.g., 800-2500 U/mg). |
| Mucin (porcine gastric, Type II) | Creates a viscous, biorelevant layer to study bioadhesion and mucus penetration. | Highly heterogeneous. Use consistent type and purification method. |
| Resazurin Sodium Salt | Redox indicator in simulated colonic fluid (SCF) to monitor metabolic activity of anaerobic bacteria. | Sterilize by filtration; avoid autoclaving. |
| Polymer Stress-Cracking Reagent | Standardized surfactant solution (e.g., Igepal CO-630) for accelerated stress corrosion testing. | Used as a positive control to compare against biorelevant fluids. |
Industry Standards and Regulatory Considerations for Chronic Implant Encapsulation
Technical Support Center
Troubleshooting Guides & FAQs
Q1: During accelerated fatigue testing (e.g., 100 million cycles), my PDMS encapsulation develops micro-cracks, leading to a rapid drop in impedance. What are the likely causes and solutions?
A: This is a classic mechanical fatigue failure. Likely causes include:
- Material Incompatibility: The modulus mismatch between the PDMS and the underlying substrate is too high, causing stress concentration at the interface.
- Inadequate Adhesion: Poor surface treatment prior to bonding creates weak points.
- Sub-Optimal Curing: Incorrect ratio of base to curing agent or insufficient cure time/time can lead to reduced elastomer toughness.
Experimental Protocol: Crack Propagation Analysis
- Sample Preparation: Fabricate encapsulated test structures with known geometry. Use a controlled plasma treatment (e.g., 30W, 45 seconds) for adhesion promotion.
- Testing: Mount samples in a custom-built or commercial cyclic flex tester (e.g., 2% strain, 10 Hz frequency).
- Monitoring: Use in-situ optical microscopy (every 1 million cycles) to image crack initiation sites.
- Analysis: Measure crack length progression and correlate with simultaneous electrochemical impedance spectroscopy (EIS) measurements (e.g., at 1 kHz).
- Solution: Implement a graded encapsulation layer or a tie-layer adhesive. Consider silicone-polyurethane hybrids for improved fatigue resistance.
Q2: My flexible encapsulation meets ISO 10993-1 biocompatibility tests initially but shows signs of delamination and inflammatory response in a 6-month murine model. What regulatory gap might this indicate?
A: This indicates a potential failure in ISO 10993-6: Implants Test for Local Effects after Long-Term Use. Standard initial biocompatibility screens (cytotoxicity, sensitization) do not predict long-term mechanical failure modes. The delamination creates micromotion, generating wear debris and a sustained inflammatory response.
Experimental Protocol: Chronic In Vivo Mechanical Integrity Assessment
- Implant Design: Fabricate devices with encapsulated wireless strain sensors or known fiducial markers.
- Surgical Implantation: Implant in the target model (e.g., subcutaneous, epineural).
- Long-Term Monitoring: Use periodic micro-CT scans (e.g., weeks 4, 12, 24) to assess delamination and device morphology.
- Histopathology: At endpoint, explant and perform histology (H&E staining). Correlate fibrous capsule thickness (measured in µm) with micro-CT evidence of mechanical failure.
- Regulatory Action: Design a Device Master File section specifically addressing in vivo mechanical stability data, justifying safety margins beyond the intended service life.
Q3: When submitting for regulatory review, what specific mechanical data for encapsulation should be included in the design dossier, beyond basic material specs?
A: Regulatory bodies (FDA, EMA) expect a physics-of-failure rationale. Include:
- Fatigue lifetime (S-N) curves under physiological strain conditions.
- Fracture toughness (K_IC) data for the encapsulation material.
- Quantitative adhesion strength (e.g., peel strength in N/cm) after accelerated aging (e.g., 85°C/85% RH for 30 days).
- Permeability data for relevant ions (Na+, Cl-) over the product's lifetime.
Experimental Protocol: Generating Regulatory-Ready Fatigue Data
- Design of Experiments (DoE): Define variables: material thickness, strain amplitude (ε), cycle count.
- Testing: Use a bio-relevant tester (in saline, 37°C). Perform tests to failure at multiple strain levels (e.g., 1%, 2%, 5%).
- Data Modeling: Fit data to a Coffin-Manson type relation:
N_f = A * (ε)^β, whereN_fis cycles to failure. - Table Presentation:
| Encapsulation Material | Thickness (µm) | Test Condition (Strain, Hz) | Mean Cycles to Failure (N_f) | Failure Mode |
|---|---|---|---|---|
| Medical Grade PDMS (Nusil MG-7-9850) | 200 | 2%, 5 Hz | 12.5 x 10^6 | Interfacial Delamination |
| Polyurethane (Tecothane AR) | 100 | 2%, 5 Hz | >200 x 10^6 | Bulk Cracking |
| Parylene C (Vapor Deposited) | 20 | 1%, 5 Hz | 3.8 x 10^6 | Pinhole Formation |
Q4: How do I design an experiment to validate that my encapsulation will last for a 10-year implant lifetime?
A: Use accelerated lifetime testing (ALT) based on recognized standards (e.g., ASTM F1980). The core principle is to apply a heightened stress (e.g., increased strain rate, temperature) to induce failure in a shorter time, then model back to real-world conditions using an Arrhenius or related model.
Experimental Protocol: ALT for 10-Year Service Life Validation
- Define Failure Criterion: E.g., >20% drop in insulation impedance or visual crack >100 µm.
- Select Stressors: Temperature (T) and mechanical strain (ε) are common. Use a minimum of 3 elevated stress levels (e.g., 37°C, 50°C, 65°C) combined with cyclic strain.
- Perform Tests: Run cohorts of samples at each stress condition until failure.
- Data Analysis: Plot failure time vs. 1/T (Kelvin). Extrapolate the line to the normal operating temperature (37°C/310K) to predict service life. Include a safety factor (e.g., 2x).
Accelerated Lifetime Testing Workflow
The Scientist's Toolkit: Research Reagent Solutions
| Item | Function & Rationale |
|---|---|
| Medical Grade Silicone (e.g., Nusil MG-7-9850) | Benchmark elastomer; provides flexibility and long-term biostability. Used for control encapsulation layers. |
| Polyurethane-based Adhesive (e.g., Loctite 4902) | Tie-layer material; improves adhesion between dissimilar materials (e.g., silicone to metal/PET) to reduce interfacial fatigue. |
| Parylene C Deposition System | Provides a conformal, pinhole-free moisture barrier. Used as a primary or secondary encapsulation layer. |
| Plasma Surface Treater (e.g., Harrick Plasma) | Critical for surface activation (oxidation) of PDMS and other polymers to achieve strong, covalent bonding. |
| Cyclic Flex Tester (e.g., Bose ElectroForce) | Instrument for applying programmable, biomimetic mechanical strain to samples in fluid for fatigue studies. |
| Electrochemical Impedance Spectroscope | Non-destructive tool to monitor insulation integrity and detect moisture ingress or cracking in real-time. |
| ASTM F749 Standard Solution | Simulates interstitial body fluid for in-vitro aging and permeability testing of encapsulation materials. |
Fatigue Failure Pathway & Regulatory Impact
Technical Support Center
Troubleshooting Guide: Common Experimental Issues
Q1: During cyclic mechanical testing of our flexible barrier film, we observe a sudden, catastrophic drop in impedance. What are the most likely causes and how can we diagnose them? A: A sudden drop in impedance typically indicates mechanical failure of the encapsulation layer. Follow this diagnostic protocol:
- Immediate Inspection: Use optical microscopy (50-100x magnification) to scan the entire cycled area for visible cracks or delamination.
- Localized Analysis: If no macro-cracks are found, perform localized electrochemical impedance spectroscopy (EIS) mapping to pinpoint the failure zone.
- Post-Mortem: Use scanning electron microscopy (SEM) on the failed region. Focus on interfacial regions between layers and look for:
- Micro-crack propagation from stress concentrators (e.g., dust particles, edge defects).
- Cohesive failure within a specific layer.
- Adhesive failure between functional and substrate layers.
Preventative Steps: Ensure cleanroom protocols during fabrication, implement edge-sealing strategies, and consider using a compliant interlayer to reduce stress concentration.
Q2: Our in vitro cell culture assays show an unexpected inflammatory response (elevated IL-1β, TNF-α) only after the encapsulation device has undergone mechanical cycling, not in static controls. What could be driving this? A: This directly correlates mechanical fatigue with biocompatibility. The likely cause is the generation of particulate debris or leachates from the fatigued material.
- Debris Analysis: Collect the supernatant from the cycled device's culture medium and perform nanoparticle tracking analysis (NTA) or flow cytometry to quantify and size particulate matter.
- Leachate Profiling: Analyze the same supernatant using ICP-MS (for metal ions) or LC-MS (for polymer oligomers/degradants) compared to static control supernatant.
- Pathway Activation: Set up a macrophage reporter cell line (e.g., THP-1 with NF-κB reporter) to confirm the debris/leachate is the direct activator of the inflammatory pathway.
Mitigation: Review the fatigue mechanism from Q1. A ductile, homogeneous material may generate fewer particulates than a brittle, multi-layer interface.
Q3: How do we accurately simulate and accelerate long-term mechanical fatigue (e.g., 5+ years) in a laboratory setting for a subdermal implant? A: Use a validated accelerated testing protocol based on the implant's specific biomechanical environment.
- Define Real-World Load Profile: Characterize the in vivo strain range via finite element analysis (FEA) modeling of the implant site.
- Design Accelerated Test: Use a higher frequency than physiological rates, but ensure it does not induce artificial heating (monitor temperature). A standard is to test at 5-10 Hz while keeping sample temperature < 37°C.
- Apply Miner's Rule: Use a spectrum of strain amplitudes to simulate varying daily activities, not just a single cyclic strain.
Accelerated Testing Calculation Example: If the device experiences 10,000 cycles per day in vivo, over 5 years (1825 days) that totals 18.25 million cycles. To achieve this in 4 weeks of continuous testing (672 hours), the required test frequency is: 18.25M cycles / (672 hours * 3600 sec/hour) ≈ 7.5 Hz.
Frequently Asked Questions (FAQs)
Q: What are the key metrics to track, beyond impedance, to correlate fatigue with biocompatibility? A: A multi-modal data approach is critical. Track these in parallel:
| Metric Category | Specific Assays/Techniques | What It Reveals |
|---|---|---|
| Barrier Integrity | Water Vapor Transmission Rate (WVTR), Calcium Assay | Direct measure of functional failure. |
| Physical Damage | SEM, Atomic Force Microscopy (AFM), White Light Interferometry | Quantifies crack density, depth, and surface topology change. |
| Material Degradation | Gel Permeation Chromatography (GPC), Fourier-Transform Infrared Spectroscopy (FTIR) | Reveals polymer chain scission, oxidation, or hydrolysis. |
| Biological Response | ELISA for cytokines (IL-1β, IL-6, TNF-α), Lactate Dehydrogenase (LDH) release, Histology (fibrous capsule thickness) | Quantifies immune activation and cytotoxicity. |
Q: Which signaling pathways are most relevant for the inflammatory response to mechanical fatigue debris? A: The primary pathways involve pattern recognition receptors (PRRs) on immune cells responding to damage-associated molecular patterns (DAMPs).
Title: Inflammatory Signaling from Fatigue Debris
Q: Can you provide a standard experimental workflow for a combined fatigue-biocompatibility study? A: Follow this integrated workflow to ensure correlated data.
Title: Integrated Fatigue-Biocompatibility Workflow
The Scientist's Toolkit: Research Reagent Solutions
| Item | Function in Fatigue-Biocompatibility Research |
|---|---|
| Polyimide or Parylene-C Substrates | Standard, well-characterized flexible substrates for building encapsulation devices. Their fatigue behavior is a common baseline. |
| PDMS (Polydimethylsiloxane) Strain Jigs | Customizable fixtures for applying cyclic uniaxial or biaxial strain to devices in vitro. |
| Simulated Body Fluid (SBF) | Ionic solution for aging tests, to study fatigue-corrosion interactions and ion leaching. |
| THP-1 Monocyte Cell Line | Human-derived cells that can be differentiated into macrophages. Ideal for standardized inflammatory response assays (cytokine ELISA, PCR). |
| NF-κB Reporter Cell Line (e.g., HEK-Blue) | Cells engineered to secrete alkaline phosphatase upon NF-κB activation. Allows quick quantification of inflammatory pathway activation by leachates. |
| Live/Dead Viability/Cytotoxicity Kit | Dual fluorescence stain (Calcein-AM/EthD-1) for quantifying cell death on or near fatigued devices. |
| Electrochemical Impedance Spectroscopy (EIS) Setup | Critical for non-destructive, continuous tracking of barrier integrity during fatigue testing. |
| DAPI (4',6-diamidino-2-phenylindole) | Nuclear counterstain for histology/immunofluorescence to assess fibrous capsule formation and cell density around explanted devices. |
Key Experimental Protocols
Protocol 1: Combined Cyclic Strain and In Situ Impedance Monitoring Objective: To track the real-time degradation of the electrical barrier properties of a flexible encapsulation device under mechanical fatigue.
- Mount the device on a custom straining jig connected to a mechanical tester inside a 37°C, sterile PBS bath.
- Connect the device's working and counter electrodes to a potentiostat configured for EIS.
- Program a cyclic strain profile (e.g., 1-5% strain, 1 Hz frequency).
- Set the potentiostat to record a brief EIS spectrum (e.g., 100 kHz to 1 Hz) at predefined intervals (e.g., every 1000 cycles).
- Fit the EIS spectra to an equivalent circuit model to extract the low-frequency impedance modulus (|Z|0.1Hz), which correlates with barrier quality.
- Continue cycling until |Z|0.1Hz drops by 2 orders of magnitude (indicating failure) or a target cycle count is reached.
Protocol 2: Macrophage Activation Assay Using Fatigue-Generated Debris Objective: To quantify the inflammatory potential of particles/debris released from a mechanically fatigued device.
- Debris Generation: Subject the device to mechanical cycling (as in Protocol 1) in a sterile, serum-free cell culture medium.
- Debris Collection: After cycling, carefully remove the device. Centrifuge the medium at 2000 x g for 10 min to pellet large fragments. Filter the supernatant through a 0.22 µm filter to sterilize, retaining nanoparticles and leachates in solution.
- Cell Culture: Differentiate THP-1 monocytes into macrophages using 100 nM PMA for 48 hours.
- Stimulation: Treat macrophages with the conditioned medium from Step 2. Use fresh medium (negative control) and LPS (1 µg/mL, positive control).
- Analysis: After 24 hours, collect supernatant for ELISA (quantify IL-1β, TNF-α). Perform qPCR on cell lysates for the same cytokines. Perform an LDH assay on supernatant to rule out cytotoxicity as the sole cause of cytokine release.
Conclusion
Addressing mechanical fatigue is not merely an engineering hurdle but a fundamental requirement for the clinical translation of flexible biomedical devices. A holistic approach—spanning foundational material science, rigorous predictive modeling, systematic process optimization, and robust validation against physiological conditions—is essential. The integration of novel nanocomposites, advanced multi-layer designs, and high-fidelity lifetime prediction models represents the forefront of this field. Future directions must focus on standardized, biologically relevant testing protocols and the development of 'smart' encapsulation capable of self-reporting fatigue damage, ultimately enabling safer, more reliable, and longer-lasting implantable technologies for drug delivery, neuromodulation, and personalized medicine.