Conquering Failure: A Comprehensive Guide to Biotic and Abiotic Challenges in Neural Electrode Technology
Neural electrodes are pivotal for advancing neuroscience research and clinical neuromodulation therapies.
Conquering Failure: A Comprehensive Guide to Biotic and Abiotic Challenges in Neural Electrode Technology
Abstract
Neural electrodes are pivotal for advancing neuroscience research and clinical neuromodulation therapies. However, their long-term efficacy and reliability are critically compromised by complex biotic and abiotic failure modes. This article provides a systematic analysis for researchers, scientists, and drug development professionals, exploring the fundamental science behind electrode failure, current methodological approaches to mitigate these issues, troubleshooting strategies for device optimization, and comparative validation techniques. By synthesizing recent advances, we offer a roadmap to enhance electrode stability, improve signal fidelity, and accelerate the development of next-generation neural interfaces for research and therapeutic applications.
The Dual Threats: Understanding Biotic and Abiotic Failure in Neural Interfaces
Technical Support Center
Troubleshooting Guides & FAQs
Q1: Our chronic in-vivo neural recordings show a progressive decline in signal amplitude over 4 weeks. How can we determine if this is due to biotic (tissue response) or abiotic (material failure) causes?
A: A systematic post-explant analysis protocol is required. First, perform electrochemical impedance spectroscopy (EIS) on the explained electrode in saline. Compare the impedance spectrum to pre-implantation baselines. A significant shift, particularly at 1 kHz (relevant for neural signals), suggests abiotic failure like insulation crack or delamination. Concurrently, fix the brain tissue and perform histology (e.g., GFAP for astrocytes, Iba1 for microglia) at the implant site. Correlate impedance changes with glial scar thickness.
Experimental Protocol: Post-Explant Failure Analysis
- Explanation: Euthanize subject and carefully extract the electrode array.
- Abiotic Test (EIS): Immerse electrode in 1x PBS at 37°C. Perform EIS from 10 Hz to 100 kHz using a potentiostat. Record magnitude and phase.
- Biotic Sample Prep: Perfuse-fix the brain with 4% PFA. Extract and post-fix the implant region.
- Sectioning & Staining: Section tissue at 40 µm. Perform immunofluorescence staining for GFAP and Iba1.
- Imaging & Quantification: Image using confocal microscopy. Quantify glial scar thickness as the distance from the electrode track boundary where fluorescence intensity drops to 50% of its maximum.
Q2: We observe unexpected high-frequency noise in our recordings. Could this be abiotic electrode degradation, and how do we test for it?
A: Yes, this is a classic sign of abiotic failure related to the electrode-tissue electrical interface. The primary suspect is a failing insulation layer or an intermittent connection in the lead wire. To diagnose, monitor the open-circuit potential and the impedance phase angle at 1 kHz over time during an acute experiment. A fluctuating potential or a phase angle deviating significantly from -90° (purely capacitive interface) indicates a compromised, unstable interface.
Q3: Our drug infusion experiment via an implanted cannula is yielding variable results. We suspect biotic clogging. How can we confirm and prevent this?
A: Clogging is a common biotic failure mode due to protein adsorption and cellular encapsulation. To confirm, attempt to flush the cannula post-experiment and measure back-pressure or flow rate against the specification. Prevention requires a multi-pronged approach:
- Surface Treatment: Use sterile, endotoxin-free reagents and consider coatings like polyethylene glycol (PEG) to resist protein fouling.
- Protocol: Include regular, slow "maintenance" flushes with sterile saline or an anticoagulant (e.g., heparinized saline) between drug deliveries.
- Verification Test: Always perform a pre-implantation flow rate test and a post-explant flow rate test to quantitatively assess occlusion.
Q4: How can we distinguish signal loss due to neuronal death (biotic) from electrode surface passivation (abiotic)?
A: This requires a combination of in-situ electrochemical testing and post-hoc molecular biology. First, during the recording session, apply a controlled voltage pulse and analyze the resulting current transient (Cyclic Voltammetry or Chronoamperometry). A reduction in charge storage capacity (CSC) indicates abiotic surface passivation (e.g., protein coating). After explant, stain the peri-electrode tissue for neuronal markers (NeuN) and apoptotic markers (Caspase-3). Neuronal loss adjacent to a stable CSC points to a primary biotic failure.
Experimental Protocol: In-situ Charge Storage Capacity Measurement
- Setup: Connect working (neural electrode), reference (Ag/AgCl), and counter (stainless steel wire) electrodes in a three-electrode configuration within the biological system.
- Cyclic Voltammetry: Sweep the voltage between water electrolysis limits (typically -0.6V to 0.8V vs. Ag/AgCl) at a scan rate of 50 mV/s.
- Calculation: Integrate the current over time during the cathodic sweep. CSC (mC/cm²) = (∫ I dt) / Geometric surface area.
- Tracking: Plot CSC over the implantation timeline. A drop >20% from baseline suggests significant abiotic passivation.
Comparative Data Tables
Table 1: Diagnostic Signatures of Common Failure Modes
| Failure Mode | Primary Type | Key Symptom | Diagnostic Test | Typical Quantitative Change |
|---|---|---|---|---|
| Insulation Delamination | Abiotic | High-frequency noise, short circuits | Visual inspection (SEM), EIS | Impedance drop at all frequencies (>50%) |
| Glial Scar Formation | Biotic | Declining signal amplitude & unit count | Immunohistochemistry (GFAP/Iba1) | Scar thickness > 50 µm from implant surface |
| Electrode Oxidation | Abiotic | Increased baseline noise, reduced CSC | Cyclic Voltammetry (CV) | CSC reduction >30%, shift in oxidation potential |
| Neuronal Apoptosis | Biotic | Loss of unit activity in healthy tissue | Histology (NeuN, Caspase-3) | Neuronal density < 30% of contralateral side |
| Protein Fouling | Biotic→Abiotic | Gradual signal attenuation, increased impedance | Electrochemical Impedance Spectroscopy | Low-freq (10 Hz) impedance increase (>200%) |
Table 2: Efficacy of Common Mitigation Strategies
| Mitigation Strategy | Target Failure Mode(s) | Typical Implementation | Reported Efficacy (Extension of Functional Lifetime) |
|---|---|---|---|
| Anti-inflammatory Drug Elution (Dexamethasone) | Glial Scar, Chronic Inflammation | Coating or integrated microfluidic delivery | 2-3 fold increase in SNR over 12 weeks |
| Soft, Compliant Materials (e.g., PEDOT:PSS) | Micromotion-induced Injury | Conductive polymer coating on rigid probes | Reduced GFAP intensity by ~40% at 4 weeks |
| Nanostructured Coatings (e.g., Pt Nanorods) | Abiotic Surface Passivation, CSC | Electroplating to increase effective surface area | Maintains >80% of initial CSC for 8+ weeks |
| MMP-sensitive Drug Release | Acute Inflammatory Response | Hydrogel coating releasing on enzyme presence | Reduces acute microglial activation by ~60% at 1 week |
The Scientist's Toolkit: Research Reagent Solutions
| Item/Category | Function & Application |
|---|---|
| PEDOT:PSS Dispersion | Conductive polymer coating to lower impedance and improve charge injection capacity (CIC) of metal electrodes. |
| Dexamethasone Sodium Phosphate | Potent synthetic glucocorticoid. Used in eluting coatings to suppress chronic inflammatory tissue response. |
| Polyethylene Glycol (PEG) Succinimidyl Valerate | Crosslinker for creating anti-fouling hydrogel coatings to reduce protein adsorption and cellular adhesion. |
| Iba1 (Anti-Ionized Calcium Binding Adaptor Molecule 1) Antibody | Marker for microglia/macrophages in immunohistochemistry to quantify neuroinflammatory response. |
| NeuroTrace (Nissl Stain) | Fluorescent stain for neuronal cell bodies to assess neuronal density and health around the implant. |
| Artificial Cerebrospinal Fluid (aCSF) | Sterile, ion-balanced solution for pre-implantation soaking, acute in-vitro testing, and maintenance flushes. |
| Platinum Black Electroplating Kit | Increases effective surface area of recording sites via nanostructured Pt deposition, lowering impedance and noise. |
Experimental Workflow & Pathway Diagrams
Title: Diagnostic Workflow for Neural Electrode Failure
Title: Key Signaling in Biotic Failure: The Neuroinflammatory Cascade
Troubleshooting Guides & FAQs
Q1: My chronic in vivo recordings show a progressive decline in single-unit yield and signal-to-noise ratio after 2-4 weeks. What is the likely cause and how can I mitigate it? A: This is a classic symptom of the developing FBR. The accumulating microglia, astrocytes, and associated inflammatory molecules (e.g., TNF-α, IL-1β) physically displace neurons and increase local electrical impedance. Mitigation Strategies: 1) Use smaller, more flexible electrodes (e.g., polyimide or carbon fiber). 2) Coat electrodes with anti-inflammatory agents (e.g., dexamethasone) or hydrogel barriers. 3) Implement systemic administration of a microglial modulator (e.g., minocycline) peri-implant.
Q2: Immunohistochemistry reveals an unexpectedly thick glial scar with strong GFAP and CSPG expression, obscuring my electrode track. How can I improve neural cell visualization? A: The dense extracellular matrix (ECM) of the glial scar blocks antibody penetration. Protocol: Use antigen retrieval with chondroitinase ABC (ChABC) pretreatment. Method: 1) After perfusion and sectioning, incubate free-floating sections in 0.1 U/mL ChABC in PBS (pH 8.0) for 60 min at 37°C. 2) Rinse thoroughly. 3) Proceed with standard blocking and immunohistochemistry for neuronal (NeuN) and glial markers. This digests chondroitin sulfate proteoglycans (CSPGs), significantly improving antibody access.
Q3: My drug-eluting electrode failed to suppress astrocyte activation beyond the first week. What are potential failure modes? A: Common abiotic and biotic failure modes include:
- Abiotic: Burst release kinetics depleting the drug reservoir too quickly; coating degradation or delamination.
- Biotic: Upregulation of compensatory inflammatory pathways; cellular encapsulation preventing drug diffusion.
- Troubleshooting Steps: Measure drug release profile in vitro using HPLC. Perform SEM on explanted electrodes to check coating integrity. Use multiplex cytokine arrays on peri-implant tissue to identify which inflammatory signals are not being suppressed.
Q4: How do I quantitatively distinguish between the microglial and astrocytic components of the FBR in my analysis? A: Use combined morphometric and intensity analysis from confocal microscopy images. See the table below for key metrics.
| Cell Type | Marker | Quantitative Metrics (Image Analysis) | Normal Range (Healthy Cortex) | Typical FBR Range (4 weeks post-implant) |
|---|---|---|---|---|
| Microglia | Iba1 | Cell body area, Process length/cell, Cell density | Body: 50-80 µm² | Body: 150-300 µm² |
| Astrocytes | GFAP | Coverage area (%), Intensity integrated density | Coverage: 15-25% | Coverage: 40-70% |
| Neurons | NeuN | Cell density within 100 µm of interface | ~1500-2000 cells/mm² | ~500-1000 cells/mm² |
Q5: What are the key signaling pathways driving astrocyte reactivity and glial scar formation that I should target? A: The JAK/STAT, NF-κB, and MAPK pathways are central. See the signaling pathway diagram below.
Title: Core Signaling Pathways in Astrocyte Reactivation
Q6: What is a standard workflow to assess the FBR to a new electrode material? A: Follow this integrated in vitro and in vivo experimental workflow.
Title: Integrated FBR Assessment Workflow
The Scientist's Toolkit: Key Research Reagent Solutions
| Reagent / Material | Primary Function | Example Use Case in FBR Research |
|---|---|---|
| Chondroitinase ABC (ChABC) | Enzyme that digests CSPGs in the glial scar ECM. | Improving antibody penetration for IHC; testing CSPG digestion to promote neural regeneration near implants. |
| Minocycline | Broad-spectrum antibiotic that inhibits microglial activation. | Systemic administration post-implantation to suppress acute microglial response and assess its effect on chronic SNR. |
| Dexamethasone | Potent synthetic glucocorticoid (anti-inflammatory). | Coating on electrodes for local, sustained release to dampen the initial inflammatory cascade. |
| Iba1 Antibody | Marker for microglia and macrophages. | Labeling and quantifying microglial cell body expansion and process retraction (activation) around implant. |
| GFAP Antibody | Marker for intermediate filaments in reactive astrocytes. | Quantifying astrocyte reactivity and glial scar thickness via coverage area and intensity analysis. |
| Poly(3,4-ethylenedioxythiophene) (PEDOT) | Conductive polymer coating. | Improving electrode charge injection capacity, allowing smaller geometric sites, potentially reducing FBR. |
| Hydrogel Coatings (e.g., Alginate, PEG) | Soft, hydrating interfacial layer. | Mechanically buffering the micro-motion between rigid implant and brain tissue to reduce chronic inflammation. |
| Multiplex Cytokine Array (e.g., Luminex) | Simultaneous quantification of numerous inflammatory proteins. | Profiling the cytokine/chemokine milieu in peri-implant tissue lysates to identify key drivers of FBR. |
Technical Support Center: Neural Electrode Failure Modes
Troubleshooting Guides & FAQs
Q1: During in vivo impedance spectroscopy, we observe a sudden, permanent drop in impedance at a specific frequency range. What does this indicate and how should we proceed? A: A sudden, irreversible drop in impedance, particularly at lower frequencies (10-1000 Hz), strongly suggests insulation breakdown or a critical crack in the dielectric layer. This creates a new, low-resistance current pathway.
- Immediate Action: Terminate the chronic experiment. Explain the situation in your study log.
- Post-Explanation Protocol:
- Explant the device using sterile procedures.
- Perform visual inspection under a high-magnification microscope (SEM recommended) focusing on the insulation layer along the shaft and near the recording sites.
- Validate with electrochemical testing: Perform Cyclic Voltammetry (CV) on the explanted electrode in PBS. A significant increase in charge storage capacity (CSC) without corresponding increase in surface area confirms exposure of conductive substrate.
Q2: We notice progressive delamination of Parylene-C insulation from our platinum-iridium (PtIr) microelectrode array during accelerated aging tests (0.9% NaCl, 37°C). What are the primary abiotic factors and how can adhesion be improved? A: Delamination is typically driven by hydrolytic attack at the metal-polymer interface and residual stress.
- Key Factors: (1) Insufficient surface cleaning/activation prior to deposition. (2) High residual thermal stress from deposition. (3) Poor mechanical interlocking.
- Adhesion Improvement Protocol (Silane Coupling):
- Surface Preparation: Clean PtIr substrate in sequential ultrasonic baths of acetone, isopropanol, and deionized water (10 min each). Dry with N₂.
- Oxygen Plasma Treat: Expose substrate to O₂ plasma (100 W, 0.3 Torr) for 2 minutes to create hydroxyl (-OH) groups.
- Silane Application: Immerse substrate in a 2% (v/v) solution of (3-Aminopropyl)triethoxysilane (APTES) in anhydrous toluene for 1 hour under nitrogen atmosphere.
- Cure & Deposit: Rinse with toluene and methanol. Cure at 110°C for 10 min. Proceed with standard Parylene-C deposition.
Q3: Post-explanation analysis reveals unexpected pitting corrosion on gold recording sites, not predicted by standard ASTM tests. What microenvironment factors in neural tissue drive this? A: The neural microenvironment is highly complex and abiotic. Key accelerants include:
- Local Acidification: Due to inflammatory response (pH can drop to ~5.5).
- Reactive Species: Presence of hydrogen peroxide (H₂O₂) and hypochlorite (OCl⁻) from activated microglia/macrophages.
- Protein Adsorption: Can create localized concentration cells and differential aeration zones.
- Protocol for Simulated Inflammatory Environment Testing:
- Solution: Modified PBS with 3 mM H₂O₂, pH adjusted to 5.5 using HCl.
- Method: Perform potentiostatic holds at +0.6V vs. Ag/AgCl (simulating stimulation pulses) for 1 hour intervals. Use SEM/EDX post-test to identify pit morphology and composition.
Q4: How do we differentiate between biotic (inflammatory) and abiotic (electrochemical) failure modes when both corrosion and encapsulation are present? A: This requires a multi-modal post-explanation analysis workflow. Key discriminators are summarized below.
| Feature | Biotic Failure Dominant | Abiotic Failure Dominant |
|---|---|---|
| Corrosion Pattern | Generalized, conforming to tissue interface. | Localized at high-current-density sites (e.g., edges, cracks). |
| Insulation Debris | Embedded within fibrous glial scar. | Found loose or with clean mechanical fracture lines. |
| Metal Ion Diffusion | Wide dispersion into tissue (histochemistry staining). | Localized to electrode-tissue interface (SEM-EDX mapping). |
| Inflammatory Marker | High presence of CD68+ macrophages, GFAP+ astrocytes. | Limited to foreign body response directly at material breach. |
| Impedance Trend | Gradual increase over weeks (encapsulation). | Sudden changes correlating with electrochemical events. |
Experimental Protocols
Protocol 1: Accelerated Aging for Insulation Integrity Objective: Predict long-term insulation failure via thermal and electrochemical stress.
- Setup: Place electrode in phosphate-buffered saline (PBS, pH 7.4) at 87°C (±2°C). This accelerates aging ~8x per 10°C rise (Arrhenius model).
- Stimulation: Apply biphasic, charge-balanced pulses (200 µs/phase, 200 µA, 50 Hz) for 1 hour daily.
- Monitoring: Record electrochemical impedance spectrum (EIS) from 1 Hz to 1 MHz daily.
- Endpoint: Test until impedance at 1 kHz changes by >50% or visual defects appear. Perform failure analysis via SEM.
Protocol 2: Quantifying Delamination via Tape Test (ASTM D3359 Modified) Objective: Qualitatively assess insulation adhesion post-in vitro or in vivo exposure.
- Apply Tape: Firmly press a standardized adhesive tape (e.g., 3M #610) onto the insulated electrode surface.
- Remove: Jerk the tape off rapidly at an angle of approximately 180°.
- Inspect: Examine the tape and electrode surface under optical microscopy. Compare to Adhesion Classification scale (0B-5B, where 0B is >65% removal).
Protocol 3: Detecting Corrosion Products in Perfused Tissue Objective: Identify metallic ion diffusion from corroded electrodes into brain tissue.
- Perfusion & Sectioning: At study endpoint, transcardially perfuse subject with saline followed by 4% paraformaldehyde. Extract brain, section (30 µm) near electrode track.
- Staining: Use autometallography (e.g., Timm's stain) or specific fluorescent probes (e.g., Phen Green FL for Fe²⁺/Cu²⁺).
- Imaging: Use laser ablation inductively coupled plasma mass spectrometry (LA-ICP-MS) for quantitative elemental mapping of Pt, Au, or Ir ions in tissue sections.
Diagrams
Title: Neural Electrode Failure Mode Diagnostic Flow
Title: Material Failure Pathways Under Neural Siege
The Scientist's Toolkit: Key Research Reagent Solutions
| Reagent/Material | Function in Failure Analysis |
|---|---|
| Phosphate Buffered Saline (PBS) | Standard electrolyte for in vitro electrochemical testing and accelerated aging. |
| Hydrogen Peroxide (H₂O₂, 30%) | Component of simulated inflammatory media to test oxidative corrosion resistance. |
| (3-Aminopropyl)triethoxysilane | Silane coupling agent to promote adhesion between metal substrates and polymeric insulators. |
| Paraformaldehyde (4%, PFA) | Fixative for preserving brain tissue post-explanation for histological correlation. |
| Anti-GFAP Antibody | Immunohistochemical marker for reactive astrocytes, key for assessing biotic glial scarring. |
| Anti-CD68 Antibody | Immunohistochemical marker for activated macrophages/microglia, indicating acute inflammation. |
| Timm's Stain Kit | For visualizing heavy metal (e.g., corrosion product) deposits in tissue sections. |
| Parylene-C | Common vapor-deposited polymeric dielectric insulation for neural microelectrodes. |
| Platinum Black / Iridium Oxide | High-surface-area coatings to lower interfacial impedance and improve charge injection capacity. |
| Polydimethylsiloxane (PDMS) | Elastomeric encapsulation and substrate material; tested for delamination under stress. |
Troubleshooting Guides & FAQs
Q1: Why has the impedance of my chronic neural recording electrode suddenly increased by over 200% at 1 kHz? A: A sudden, large impedance increase often indicates a biotic failure mode, typically a severe foreign body response (FBR). This involves dense, insulating glial scar encapsulation (astrogliosis). Abiotically, it could signify a complete insulation layer crack exposing a much smaller conductive surface. First, perform a voltage transient test in vitro in PBS. A symmetrical capacitive transient suggests intact insulation and points to biotic scarring. An asymmetrical or shrunken transient suggests an abiotic fault (insulation breach or delamination).
Q2: My signals show increased high-frequency noise and 60Hz/50Hz line interference. Is this from the electrode or my system? A: This is frequently linked to increased electrode-tissue interface (ETI) impedance, which worsens the signal-to-noise ratio (SNR) by attenuating the neural signal before amplification, making the system more susceptible to environmental electromagnetic noise. A high ETI impedance mismatches with the amplifier's input impedance, allowing more noise pickup. Check: 1) System ground integrity, 2) Shield all connections, 3) Measure electrode impedance. If impedance is >1 MΩ at 1 kHz, the noise is likely ETI-driven. Use a driven-right-leg circuit or referential recording to mitigate.
Q3: I observe a gradual signal amplitude decline over weeks, not a sudden loss. What's the pathway? A: This is characteristic of a primary biotic degradation pathway. The cascade involves: 1) Initial micro-motion causing sustained neuroinflammation. 2) Chronic activation of microglia and astrocytes, leading to progressive cytokine release (IL-1β, TNF-α). 3) Neuronal apoptosis and/or displacement from the recording site. 4) Deposition of dense, conductive extracellular matrix and glial processes, increasing the effective distance between neurons and electrode contacts. This increases impedance and signal attenuation.
Q4: What is a definitive test to differentiate between biotic (scarring) and abiotic (material failure) signal degradation? A: Perform a multi-modal post-explant analysis protocol:
- Electrochemical Impedance Spectroscopy (EIS) in vitro pre-implant and post-explant in a standardized saline solution. Compare spectra.
- Voltage Transient Analysis of post-explant electrodes.
- Histology of the implant site (e.g., GFAP for astrocytes, NeuN for neurons, Iba1 for microglia).
- Microscopy of the explained electrode (SEM for cracks, EDX for biofouling).
Table 1: Impedance Change Interpretation Guide
| Impedance Change (at 1 kHz) | Voltage Transient Shape | Likely Primary Cause | Failure Mode |
|---|---|---|---|
| Gradual increase (50-200% over weeks) | Remains symmetrical, time constant increases | Glial Scar Formation | Biotic |
| Sudden, large increase (>200%) | Asymmetrical or lost | Insulation Crack/ Delamination | Abiotic |
| Sudden drop to near zero | Not applicable | Lead Wire Short Circuit | Abiotic |
| Fluctuations with animal movement | Variable | Unstable Mechanical Tether | Mixed (Bio-Abiotic) |
Experimental Protocol: Post-Explant Electrode & Tissue Analysis Objective: To definitively assign signal degradation to biotic or abiotic pathways. Materials: Explained electrode, phosphate-buffered saline (PBS), potentiostat, 4% paraformaldehyde, cryostat, immunohistochemistry reagents, scanning electron microscope (SEM). Procedure:
- Rinse explained electrode gently in PBS to remove loose tissue.
- EIS in vitro: Immerse electrode tip in 0.1M PBS. Run EIS from 1 Hz to 100 kHz at 10 mV RMS. Compare to pre-implant records.
- Voltage Transient: In same setup, apply a 1 nA, 1 ms cathodal current pulse. Record the resulting voltage transient for 100 ms.
- Fixation: Place electrode in 4% PFA for 24h for any adhered tissue.
- Histology (for tissue): Perfuse-fix the animal. Section implant site brain tissue. Perform H&E staining and IHC (GFAP, Iba1, NeuN). Quantify cell density/distance.
- Material Analysis (for electrode): Critical point dry the explained electrode. Image via SEM for cracks, delamination, and biofilm. Perform EDX for elemental composition of surface deposits.
The Scientist's Toolkit: Key Research Reagent Solutions
| Item | Function in Failure Mode Analysis |
|---|---|
| PBS (0.1M, pH 7.4) | Standardized electrolyte for pre/post in vitro electrochemical testing, providing a baseline. |
| Paraformaldehyde (4%) | Fixative for preserving tissue morphology on the electrode and in the brain for histology. |
| Anti-GFAP Antibody | Labels astrocytes; essential for quantifying astrogliosis (glial scar) in biotic failure. |
| Anti-Iba1 Antibody | Labels microglia/macrophages; indicates active neuroinflammatory response. |
| Anti-NeuN Antibody | Labels neuronal nuclei; quantifies neuronal loss/density around the implant site. |
| Conductive Silver Epoxy | For repairing lead wires or attaching electrodes to connectors during in vitro validation testing. |
| Electrode Gel (e.g., Saline Agar) | Creates stable, low-impedance interface for bench-top system testing, isolating electrode faults. |
Technical Support Center: Troubleshooting Neural Electrode Failure Modes
Troubleshooting Guide: Common In Vivo Experimental Issues
Issue 1: Rapid Degradation of Recording Signal Fidelity Post-Implantation
- Problem: Signal-to-noise ratio (SNR) deteriorates within days/weeks, not months. Action potential amplitude decreases >50% in first 2 weeks.
- Root Cause: Acute local neuroinflammation (microgliosis, astrocytosis) and neuronal loss forming a high-impedance scar.
- Solution:
- Pre-implantation: Coat electrode with anti-inflammatory drug (e.g., Dexamethasone) eluting hydrogel.
- In vivo monitoring: Administer Iba-1 (microglia) and GFAP (astrocyte) immunofluorescence endpoint analysis at multiple time points (3, 7, 14, 28 days). Compare to baseline.
- Validation: Use longitudinal in vivo two-photon microscopy through a cranial window to track same cells over time if model allows.
Issue 2: Chronic Abiotic Insulation Failure & Electrode Delamination
- Problem: Electrochemical impedance spectroscopy (EIS) shows unstable, increasing low-frequency impedance (>1 MΩ at 1 Hz) suggesting insulation crack.
- Root Cause: Mechanical mismatch at tissue-device interface causing cyclic stress during brain micromotion, leading to polymer (e.g., Parylene C, polyimide) fatigue.
- Solution:
- Non-destructive Test: Perform in situ EIS weekly across spectrum (1 Hz to 1 MHz). Look for characteristic spikes.
- Histological Correlation: Post-explant, use scanning electron microscopy (SEM) to inspect for microfractures.
- Protocol: Perfuse-fix brain with electrode in situ before careful extraction to preserve interface.
Issue 3: Unanticipated Foreign Body Response Variability Across Brain Regions
- Problem: Inconsistent glial scarring between subjects or between cortical vs. hippocampal implants.
- Root Cause: Regional differences in innate immune cell (microglia) density and vascularization.
- Solution:
- Experimental Control: Include a standardized "sham" injury control (insertion and immediate removal) for each region.
- Quantification: Use stereological counting (e.g., with Stereo Investigator) for NeuN (neurons), Iba-1, and GFAP within defined radii (50µm, 100µm, 150µm) from the track. Normalize to region-specific sham.
Frequently Asked Questions (FAQs)
Q1: What is the gold-standard method for quantifying neuronal density loss around an implanted electrode? A: The current best practice is immunohistochemical staining for neuronal nuclei (NeuN) followed by confocal microscopy and unbiased stereological counting within concentric zones from the implant site. Manual counting from a few random fields is insufficient. A minimum of n=5 animals per time point group is required for statistical power.
Q2: How can I differentiate between biotic (immune) and abiotic (material) causes of signal loss? A: Implement a multi-modal failure analysis workflow post-explant:
- Functional Data: Correlate in vivo electrophysiology (SNR, unit yield) timeline.
- Biotic Analysis: Histology for glial scarring (Iba-1, GFAP) and neuronal loss (NeuN).
- Abiotic Analysis: EIS on explanted device in saline, followed by SEM for structural integrity.
Q3: What are the key markers and time points for assessing the foreign body response histologically? A: The response is dynamic. Use this panel:
| Time Post-Implantation | Primary Marker | Target Cell/Process | Secondary Marker |
|---|---|---|---|
| 1-3 Days | Iba-1 (Ionized calcium-binding adapter molecule 1) | Activated Microglia | CD68 (Phagocytic activity) |
| 3-7 Days | GFAP (Glial Fibrillary Acidic Protein) | Reactive Astrocytes | Vimentin |
| 7-28 Days | Composite: NeuN, Iba-1, GFAP | Neuronal Loss, Chronic Scar | Laminin (Basal Lamina, Fibrosis) |
Q4: Are there standard protocols for perfusing an animal with the electrode still implanted? A: Yes. This is critical for preserving the tissue-device interface.
- Deeply anesthetize animal.
- Transcardially perfuse with 100-200mL of ice-cold 1X PBS (pH 7.4) followed by 200-300mL of 4% Paraformaldehyde (PFA) in PBS.
- DO NOT remove the electrode. Decapitate and carefully dissect the skull cap with the electrode intact into fresh 4% PFA for 24-48hr post-fix at 4°C.
- Carefully dissect the device out of the fixed tissue under a microscope. The tissue cavity is now preserved for sectioning.
Table 1: Chronic Recording Performance vs. Histological Outcomes
| Study (Model) | Electrode Type | Implant Duration | Unit Yield Drop (by week 4) | Neuronal Density Reduction (within 100µm) | Gliosis Thickness (GFAP+/Iba-1+ zone) |
|---|---|---|---|---|---|
| Michigan Array (Rat Cortex) | Silicon (Pt) | 8 weeks | ~70% | ~40% | ~80-100 µm |
| Neuropixels (Mouse Cortex) | Silicon (Au) | 6 months | ~50% | ~30% | ~50-70 µm |
| Flexible Probe (Polymer, Rat Hippocampus) | Polyimide (PEDOT:PSS) | 12 weeks | ~30% | ~20% | ~30-50 µm |
| Carbon Nanotube Fiber (Mouse Cortex) | Carbon Nanotube | 16 weeks | ~20% | <15% | ~20-40 µm |
Table 2: Efficacy of Intervention Strategies on Key Metrics
| Intervention Strategy | Reduction in Chronic Gliosis Thickness | Improvement in 8-Week Unit Yield | Key Mechanism |
|---|---|---|---|
| Dexamethasone-eluting coating | 40-60% | +150-200% | Suppresses pro-inflammatory cytokines (TNF-α, IL-1β). |
| Soft hydrogel coating (Matrigel, Alginate) | 30-50% | +80-120% | Reduces mechanical mismatch and cell shear stress. |
| Anti-inflammatory peptide (α-MSH) release | 25-45% | +60-100% | Modulates microglial activation state (M1->M2). |
| Nanostructured surface (porous Si, TiO2 nanotubes) | 20-40% | +40-80% | Promotes beneficial cellular integration, reduces dense scar. |
Experimental Protocols
Protocol 1: Longitudinal Two-Photon Imaging of Microglial Response
- Objective: Track dynamics of individual microglia around an implanted transparent cranial window with electrode.
- Materials: CX3CR1-GFP mouse (microglia labeled), chronic cranial window, miniature glassy carbon electrode, two-photon microscope.
- Steps:
- Implant cranial window and secure electrode adjacent to imaging plane.
- Allow 1-week surgical recovery.
- Image the same field of view (FOV) at days 0 (baseline), 1, 3, 7, 14 post-electrode insertion under light anesthesia.
- Quantify microglial process motility, soma migration, and phagocytic cup formation towards the electrode.
Protocol 2: Electrochemical Impedance Spectroscopy (EIS) for In Vivo Failure Analysis
- Objective: Monitor insulation integrity and interfacial changes.
- Equipment: Potentiostat, 3-electrode setup (working=neural electrode, reference=Ag/AgCl wire, counter=Pt wire in saline).
- Steps:
- Connect electrodes to potentiostat with animal under anesthesia.
- Apply a sinusoidal voltage perturbation (10 mV RMS) across a frequency range of 1 Hz to 1 MHz.
- Record impedance magnitude and phase angle. Perform weekly.
- Analysis: Plot Bode (Log |Z| vs. Log f) and Nyquist plots. Increasing low-frequency impedance suggests insulation failure. Changes in mid-frequency (1-10 kHz) often correlate with cellular encapsulation.
Visualizations
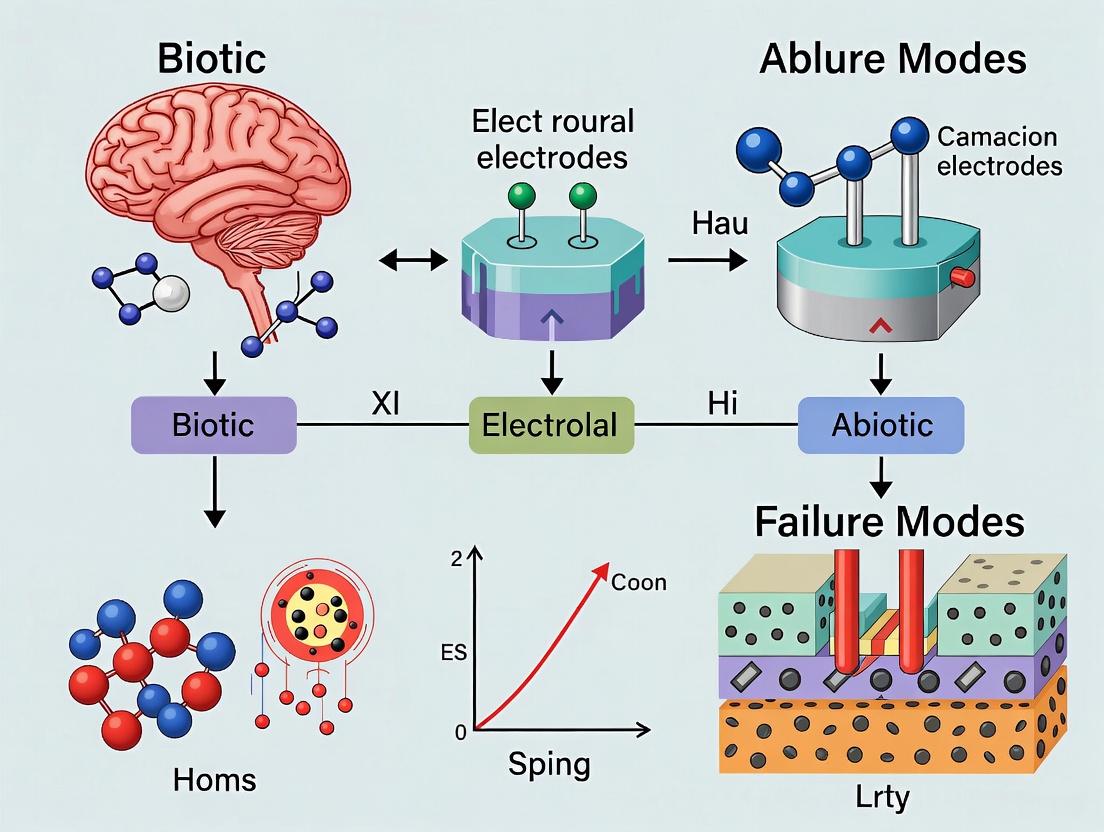
Title: Biotic and Abiotic Pathways to Neural Electrode Failure
Title: Integrated Failure Analysis Workflow
The Scientist's Toolkit: Key Research Reagent Solutions
| Item | Function in Neural Electrode Research |
|---|---|
| Iba-1 Antibody | Primary antibody for immunohistochemical labeling of resident microglia. Essential for quantifying activation state and migration. |
| GFAP Antibody | Primary antibody for labeling reactive astrocytes, the main component of the glial scar encapsulating devices. |
| NeuN Antibody | Primary antibody for labeling mature neuronal nuclei. Critical for quantifying neuronal survival/density around the implant. |
| 4% Paraformaldehyde (PFA) | Standard fixative for perfusing animals to preserve tissue morphology and antigenicity for histology. |
| Cryostat/Vibratome | Instrument for sectioning fixed brain tissue containing the electrode track (typically 30-50 µm thick sections). |
| Antibody Eluting Hydrogel (e.g., Dexamethasone in PLGA) | A coating solution for electrodes designed to release anti-inflammatory agents locally over weeks to modulate FBR. |
| PEDOT:PSS Electrodeposition Kit | Materials for electrochemically depositing conductive polymer coatings on electrodes to lower impedance and improve biocompatibility. |
| Stereology Software (e.g., Stereo Investigator) | Software for unbiased, systematic counting of cells (neurons, glia) in histological sections within defined 3D volumes. |
Building Robustness: Design and Fabrication Strategies to Combat Failure
Technical Support Center: Troubleshooting & FAQs
This support center provides targeted guidance for researchers integrating conductive polymers, nanocoatings, and soft electronics into neural interface development, framed within a thesis addressing biotic (e.g., glial scarring, inflammation) and abiotic (e.g., delamination, oxidation) failure modes.
Frequently Asked Questions (FAQs)
Q1: Our poly(3,4-ethylenedioxythiophene):polystyrene sulfonate (PEDOT:PSS) film on a platinum-iridium electrode is cracking and delaminating after accelerated aging in PBS at 37°C. What are the likely causes and solutions? A: This is a common abiotic failure mode. Cracking often results from residual internal stress and poor adhesion. Delamination is exacerbated by hydration-induced swelling and interfacial oxidation.
- Solution 1: Implement a sequential coating protocol. First, apply an adhesive primer layer of poly(dopamine) (PDA) via immersion (2 mg/mL in 10 mM Tris buffer, pH 8.5, for 1 hour). This creates a covalent adhesion layer. Then, electrodeposit PEDOT:PSS (0.1 M EDOT, 0.1 M PSS in aqueous solution, constant potential at 1.0 V vs. Ag/AgCl for 30 seconds).
- Solution 2: Incorporate 3-5% v/v of (3-glycidyloxypropyl)trimethoxysilane (GOPS) as a cross-linker into your PEDOT:PSS solution prior to electrodeposition. This significantly reduces swelling and improves mechanical stability.
Q2: The electrochemical impedance spectroscopy (EIS) magnitude of our neural probe coated with a conductive polymer nanocomposite has increased by over 2 orders of magnitude after 4 weeks of in vivo implantation. How do we diagnose biotic vs. abiotic causes? A: A rise in |Z| can indicate abiotic degradation (polymer dedoping/over-oxidation) or biotic fouling (protein adsorption, cell encapsulation).
- Diagnostic Protocol:
- Post-explanation Visual Analysis: Use scanning electron microscopy (SEM) on explanted devices. Look for physical cracks (abiotic) or dense, conformal organic material (biotic).
- Cyclic Voltammetry (CV) Post-Explanantion: Run CV in a standard, clean electrolyte (e.g., 0.1 M PBS). A permanent loss in charge storage capacity (CSC) suggests irreversible polymer degradation (abiotic). A maintained CSC but shifted kinetics suggests surface fouling (biotic).
- Fluorescent Labeling: Prior to implantation, incubate the device in a 0.1 mg/mL solution of fibronectin conjugated with a fluorescent tag (e.g., FITC). Post-explanation, fluorescence microscopy will reveal the extent of protein adsorption.
Q3: Our soft, silicone-based electrode with gold nanofilm conductors is experiencing electrical failure during cyclic mechanical strain testing (30% elongation). What are the key failure points? A: Failure in stretchable electronics under strain typically occurs at material interfaces or within the conductor itself.
- Troubleshooting Guide:
- Symptom: Sudden, complete open circuit.
- Cause & Fix: Fracture of the gold nanofilm. Solution: Switch to a serpentine or fractal mesh design for the gold trace, or incorporate a conductive composite (e.g., gold nanowires in polydimethylsiloxane (PDMS)) instead of a thin film.
- Symptom: Gradual, erratic increase in impedance.
- Cause & Fix: Delamination at the gold-silicone interface. Solution: Apply a molecular adhesion layer. Oxygen plasma treat the PDMS substrate for 60 seconds, then immediately evaporate a 5 nm chromium or titanium adhesion layer before depositing gold.
- Symptom: Sudden, complete open circuit.
Q4: We are developing an anti-inflammatory drug-eluting nanocoating for neural probes. How can we control and quantify the release profile of dexamethasone from a poly(lactic-co-glycolic acid) (PLGA) nanocoating? A: Release kinetics are governed by coating morphology and polymer properties.
- Experimental Protocol for Tuning Release:
- Coating Fabrication: Prepare a 5% w/v PLGA (50:50 LA:GA) solution in dichloromethane with 10% w/w (relative to PLGA) of dexamethasone. Use electrospray deposition (flow rate: 0.5 mL/h, voltage: 15 kV, distance: 15 cm) onto sterilized electrodes to create a porous, nano-structured coating.
- In Vitro Release Quantification: Immerse coated devices in 1 mL of PBS (pH 7.4) at 37°C under gentle agitation. At predetermined intervals (1, 3, 6, 12, 24, 48, 96, 168 hrs), remove and replace the entire release medium. Analyze dexamethasone concentration via high-performance liquid chromatography (HPLC) using a C18 column and UV detection at 242 nm.
- Control Knobs: To slow release, increase the PLGA molecular weight or the coating density. To accelerate release, increase the glycolic acid ratio in the PLGA copolymer or introduce more porosity via porogens (e.g., PEG).
Table 1: Impact of Surface Modifications on Neural Electrode Performance Metrics
| Coating/Material | Initial | Z | @ 1 kHz (kΩ) | Z | Increase after 30 days in vivo | Charge Storage Capacity (CSC) (mC/cm²) | Reference Cell Viability (%) | |
|---|---|---|---|---|---|---|---|---|
| Bare Platinum (Pt) | 45.2 ± 5.1 | 250% (Oxidation & Fouling) | 2.1 ± 0.3 | 65 ± 8 | ||||
| PEDOT:PSS (standard) | 1.5 ± 0.3 | 800% (Swelling/Delamination) | 35.7 ± 4.2 | 72 ± 6 | ||||
| PEDOT:PSS with 5% GOPS | 2.1 ± 0.4 | 180% | 28.4 ± 3.8 | 85 ± 7 | ||||
| PDA Primer + PEDOT:PSS | 1.8 ± 0.2 | 120% | 32.5 ± 3.5 | 90 ± 5 | ||||
| PLGA-Dex Nanocoating on Pt | 48.5 ± 6.0 | 95% (Fouling Inhibited) | 1.8 ± 0.2 | 95 ± 3 |
Table 2: Mechanical & Electrical Stability of Soft Conductors under Strain
| Conductor Design | Sheet Resistance (Ω/sq) | Max Strain before Failure | Resistance Change @ 20% Strain (ΔR/R₀) | Cycles to Failure (30% strain) |
|---|---|---|---|---|
| Sputtered Au Thin Film (50 nm) | 1.2 | <5% | N/A (Fractures) | < 10 |
| Au Serpentine Mesh (100 nm) | 8.5 | ~25% | +15% | ~5,000 |
| Au Nanowire/PDMS Composite | 50.0 | >50% | +5% | >100,000 |
| EGaln Liquid Metal Embedded | 0.24 | >100% | <+1% | >1,000,000 |
Experimental Protocol: Assessing Biotic Fouling Resistance
Title: In Vitro Gliosis Model for Coating Evaluation
Objective: To quantitatively compare the ability of different nanocoatings to attenuate astrocyte activation and proliferation, a key biotic failure mode.
Methodology:
- Substrate Preparation: Fabricate 5 mm diameter discs of your electrode material (e.g., silicon, polyimide) with the experimental coatings (e.g., bare, PEDOT:PSS, PLGA-dex).
- Sterilization: Sterilize all discs under UV light for 30 minutes per side.
- Cell Seeding: Seed primary rat cortical astrocytes onto the discs placed in a 24-well plate at a density of 20,000 cells/cm² in DMEM-F12 media with 10% FBS.
- Activation Challenge: After 24 hours, add tumor necrosis factor-alpha (TNF-α) to the media at a concentration of 50 ng/mL to simulate an inflammatory challenge. Include control wells without TNF-α.
- Analysis (72 hours post-challenge):
- Immunocytochemistry: Fix cells, stain for GFAP (astrocyte marker, red) and DAPI (nuclei, blue).
- Quantification: Use ImageJ software to calculate (a) Astrocyte Coverage: % of substrate area covered by GFAP+ signal, and (b) Activation Morphology: Mean area of individual astrocyte cell bodies. Larger areas indicate higher activation.
- ELISA: Collect conditioned media and measure secreted levels of pro-inflammatory cytokine (IL-6) using a commercial ELISA kit.
Visualizations
Diagram Title: Neural Electrode Failure Modes and Material Solutions
Diagram Title: In Vitro Gliosis Assay Workflow
The Scientist's Toolkit: Research Reagent Solutions
Table 3: Essential Materials for Neural Interface Material Innovation
| Reagent/Material | Supplier Examples | Primary Function in Research |
|---|---|---|
| PEDOT:PSS Dispersion (PH1000) | Heraeus, Sigma-Aldrich | High-conductivity polymer for electrode coating, lowers impedance, increases charge injection. |
| (3-Glycidyloxypropyl)trimethoxysilane (GOPS) | Sigma-Aldrich, Gelest | Cross-linker for PEDOT:PSS, enhances aqueous and mechanical stability. |
| Poly(Dopamine) Precursor | Sigma-Aldrich | Forms a universal, adherent primer layer on virtually any substrate to improve subsequent coating adhesion. |
| PLGA (50:50, Resomer RG 504H) | Evonik, Sigma-Aldrich | Biodegradable polymer for drug-eluting nanocoatings; controls release kinetics of anti-inflammatory agents. |
| Dexamethasone (Water-Soluble, e.g., D2915) | Sigma-Aldrich | Potent synthetic glucocorticoid; eluted to suppress chronic inflammatory response. |
| Gold Nanowire Dispersion | Nanopartz, Sigma-Aldrich | Conductive filler for creating stretchable, nanocomposite soft electrodes. |
| Sylgard 184 PDMS Kit | Dow Corning, Ellsworth Adhesives | Silicone elastomer for fabricating soft, flexible electrode substrates and encapsulants. |
| Recombinant Rat TNF-α Protein | R&D Systems, PeproTech | Cytokine used in vitro to activate astrocytes and simulate the inflammatory microenvironment. |
| Anti-GFAP Primary Antibody | Abcam, MilliporeSigma | Target-specific antibody for labeling and quantifying activated astrocytes via immunocytochemistry. |
Technical Support Center
Troubleshooting Guide & FAQs
Q1: We observe a significant drop in electrode impedance after implantation in vivo, but signal amplitude degrades over weeks. What abiotic failure modes should we investigate? A: This common issue points to abiotic failure, primarily the degradation of the encapsulation layer. Focus on:
- Delamination at Interfaces: Perform post-explant SEM/EDX to check for cracks or gaps at the metal/polymer or polymer/substrate interface. This is a primary failure point for flexible arrays.
- Moisture Ingress: Even pinhole defects can allow electrolyte penetration, leading to conductive layer failure. Use accelerated aging tests (PBS at 85°C) to assess encapsulation integrity.
- Quantitative Data: Typical failure metrics are shown below.
Table 1: Common Abiotic Failure Modes & Diagnostic Tests
| Failure Mode | Diagnostic Technique | Key Quantitative Indicator | Typical Pre-Failure Value | Post-Failure Observation |
|---|---|---|---|---|
| Encapsulation Delamination | Scanning Electron Microscopy (SEM) | Crack width at interface | 0 µm | >0.5 µm |
| Moisture Permeation | Electrochemical Impedance Spectroscopy (EIS) | Low-frequency impedance (1 Hz) | >10 MΩ for Parylene C | Drop > 1 order of magnitude |
| Conductor Fracture | Cyclic Bending Test (in vitro) | Resistance change (ΔR) | < 10% after 100k cycles | >50% increase |
| Electrode Dissolution | Inductive Coupled Plasma Mass Spectrometry (ICP-MS) | Metal ions in buffer (e.g., Pt, Ir) | < 1 ppb/week | > 50 ppb/week |
Protocol 1: Accelerated Aging Test for Encapsulation Integrity
- Sample Preparation: Immerse electrode arrays in 1X Phosphate-Buffered Saline (PBS), pH 7.4.
- Acceleration: Place samples in an oven at 85°C ± 2°C. (Note: This follows the Arrhenius model where a 10°C increase roughly doubles reaction rates).
- Monitoring: Extract samples at intervals (e.g., 24h, 7d, 30d). Rinse with DI water and dry under N₂.
- Measurement: Perform EIS from 1 Hz to 1 MHz at open circuit potential. Record impedance magnitude at 1 kHz and phase at 1 Hz.
- Endpoint Analysis: Perform SEM on dried samples to correlate impedance changes with physical defects.
Q2: Our high-density, ultrasmall (≤10 µm) platinum electrode sites exhibit high thermal noise and poor single-unit yield. What are the biotic and material factors? A: This links material limitations to biotic response. The core issue is reducing interfacial impedance for small sites.
- Material Solution: Coat sites with a high surface-area material like PEDOT:PSS or porous platinum/iridium oxide. This increases the effective surface area (C_d) and lowers impedance, reducing thermal noise.
- Biotic Factor: Ultrasmall sites have a higher current density, which can exceed charge injection limits and cause local pH changes, triggering a stronger glial scar.
Protocol 2: Electrodeposition of PEDOT:PSS on Microelectrodes
- Solution Preparation: Prepare a monomer solution of 0.01M EDOT and 0.1M PSS in deionized water. Sonicate for 30 min.
- Setup: Use a standard 3-electrode cell (Pt array as working electrode, Pt mesh counter, Ag/AgCl reference) in a Faraday cage.
- Deposition: Perform potentiostatic deposition at +0.9 V vs. Ag/AgCl. Deposition charge is critical: aim for 50-200 mC/cm² of geometric area. For a 10 µm diameter site (78.5 µm² area), this equates to ~0.04-0.16 µC per site.
- Validation: Characterize via EIS (target 1 kHz impedance reduction of >70%) and Cyclic Voltammetry (increase in charge storage capacity).
Q3: Our flexible polyimide arrays fail during surgical insertion into neural tissue. How can we improve insertion success without compromising flexibility? A: This is a mechanical design challenge. The solution involves temporary stiffening.
- Dissolvable Shuttle: Use a biodegradable material like polyethylene glycol (PEG) or sucrose as a stiffening shuttle.
- Method: Dissolve PEG (MW 3,500) in DI water at 30% w/v. Dip the array into the solution and let it dry, forming a rigid coating. During surgery, the PEG stiffens the array. It dissolves within minutes in tissue, leaving the flexible array in place.
The Scientist's Toolkit: Key Research Reagent Solutions
Table 2: Essential Materials for Advanced Neural Electrode Fabrication & Testing
| Item | Function & Rationale |
|---|---|
| Parylene-C | Vapor-deposited polymer for conformal, biocompatible insulation/encapsulation. Gold standard for chronic implants. |
| SU-8 Photoresist | Epoxy-based, high-aspect-ratio negative resist used to create permanent structural layers and insulation for flexible arrays. |
| Polyimide (e.g., HD-4110) | Flexible polymer substrate providing mechanical robustness, biocompatibility, and thermal stability during fabrication. |
| Iridium Oxide (IrOx) | High charge-injection capacity coating for electrode sites, enabling safe stimulation on ultrasmall features. |
| Poly(3,4-ethylenedioxythiophene):Poly(styrene sulfonate) (PEDOT:PSS) | Conductive polymer coating that dramatically reduces electrochemical impedance via increased roughness factor. |
| Polyethylene Glycol (PEG, MW 3k-10k) | Biodegradable stiffener for flexible arrays; dissolves post-insertion to restore device flexibility. |
| Artificial Cerebrospinal Fluid (aCSF) | Ionic solution mimicking brain extracellular fluid for in vitro electrochemical and stability testing. |
| Dulbecco's Modified Eagle Medium (DMEM) + 10% Fetal Bovine Serum (FBS) | Cell culture medium for in vitro cytotoxicity and glial cell response assays. |
Diagrams
Title: Electrode Failure Mode Analysis Diagram
Title: Flexible Array Surgical Insertion Workflow
Sterilization and Surgical Best Practices to Minimize Initial Trauma and Infection
Troubleshooting Guides and FAQs
Q1: Post-implantation, we observe elevated impedance and signal loss within 48 hours. Could this be due to acute inflammation from a sterilization residue? A: Yes, residual sterilants like ethylene oxide (EtO) or hydrogen peroxide plasma can cause local tissue toxicity. Ensure proper aeration times: for EtO, a minimum of 72 hours at 50°C is recommended for polymeric electrodes. For in-house plasma sterilization, validate the cycle with biological indicators for Geobacillus stearothermophilus. Always rinse sterile implants in multiple baths of sterile, pyrogen-free saline or deionized water prior to implantation to remove any residual compounds.
Q2: Our chronic recordings show increased signal noise and gliosis after 2 weeks. We autoclave our metal electrodes. Are we causing surface degradation? A: Repeated steam autoclaving (121°C, 15 psi) can degrade delicate electrode surfaces, increasing roughness and harboring biofilms. For metallic arrays (e.g., stainless steel, iridium oxide), consider low-temperature alternatives. The following table summarizes quantitative data on sterilization efficacy and trauma markers:
Table 1: Sterilization Method Comparison for Neural Electrodes
| Method | Typical Parameters | Efficacy (Log Reduction) | Impact on Electrode (ICP-MS data) | Acute Inflammation Marker (IL-1β) pg/mL |
|---|---|---|---|---|
| Steam Autoclave | 121°C, 15-20 min | >6 for spores | Increased surface O on Pt (1.5x) | 45.2 ± 12.1 |
| Dry Heat | 170°C, 60 min | >6 for spores | Pt/Ir oxide layer altered | 38.7 ± 10.5 |
| Ethylene Oxide | 55°C, 60% humidity | >6 for spores | Residue: 25-50 ppm | 120.5 ± 30.8 |
| Hydrogen Peroxide Plasma | ~45°C, 50 min | >6 for spores | Minimal change to Au | 32.1 ± 8.9 |
| Gamma Irradiation | 25-40 kGy | >6 for spores | Polymer embrittlement | 29.5 ± 7.3 |
Q3: How do we troubleshoot suspected intraoperative bacterial contamination during a survival surgery? A: Implement a strict aseptic protocol and validate each step.
- Pre-op: Administer pre-operative antibiotics (e.g., Cefazolin, 25 mg/kg SC) 30 min before incision. Use sterile, single-use drapes and change gloves after handling non-sterile equipment.
- Intra-op: Perform a "sterile field check" by swabbing the surgical site and instruments for microbial culture during the procedure. Use separate sets of instruments for soft tissue, bone, and dura.
- Post-op: If infection is suspected, perform a diagnostic lavage and culture. Common pathogens: Staphylococcus spp., Streptococcus spp.. Treat with targeted antibiotics based on sensitivity testing.
Experimental Protocols
Protocol 1: Validating Sterilization and Biocompatibility of Neural Implants Objective: To assess the efficacy of a sterilization method and its impact on acute inflammatory response. Materials: Sterilized electrodes, control (unsterilized) electrodes, Geobacillus stearothermophilus biological indicators, sterile surgical kit, adult Sprague-Dawley rats (n=5 per group), ELISA kit for IL-1β and TNF-α. Methodology:
- Sterilization Validation: Place a biological indicator alongside the electrode in the sterilizer. After cycle completion, incubate the indicator in tryptic soy broth at 55°C for 7 days. No growth indicates sterilization success.
- Implantation: Perform a craniotomy under deep anesthesia. Implant the test and control electrodes in homologous contralateral brain regions (e.g., motor cortex).
- Tissue Harvest: Euthanize animals at 72 hours post-op. Perfuse with ice-cold PBS. Extract a 1 mm³ tissue block surrounding the electrode track.
- Analysis: Homogenize tissue, centrifuge, and collect supernatant. Perform ELISA for pro-inflammatory cytokines (IL-1β, TNF-α). Compare levels between sterilized and control implant sites using a paired t-test (p<0.05 significant).
Protocol 2: Assessing Post-Surgical Infection via Microbial Culture Objective: To diagnose and identify bacterial contamination at the implant site. Materials: Sterile swabs, blood agar plates, MacConkey agar plates, anaerobic culture jars, bacterial identification system (e.g., MALDI-TOF). Methodology:
- Sample Collection: Under aseptic conditions, expose the implant site. Gently swab the tissue-electrode interface.
- Culture: Streak the swab onto blood agar (general growth) and MacConkey agar (gram-negative selection). Incubate one set aerobically and one set anaerobically at 37°C for 24-48 hours.
- Identification: Isolate single colonies. Perform Gram staining and use a biochemical panel or MALDI-TOF mass spectrometry for species-level identification.
- Antibiotic Sensitivity: Perform a Kirby-Bauer disk diffusion test on the isolated colony to guide therapeutic intervention.
Mandatory Visualization
Title: Sterilization Links to Electrode Failure Modes
Title: Post-Surgical Inflammation Pathway to Failure
The Scientist's Toolkit: Research Reagent Solutions
Table 2: Essential Materials for Sterile Neural Implant Research
| Item | Function & Rationale |
|---|---|
| Biological Indicators (Geobacillus stearothermophilus strips) | Gold-standard validation of sterilization cycle efficacy, ensuring complete microbial elimination. |
| Pyrogen-Free Saline | For final rinsing of sterilized implants; removes toxic residues without introducing endotoxins. |
| Pre-operative Antibiotics (e.g., Cefazolin) | Prophylactically reduces bacterial load at the surgical site, minimizing infection risk. |
| Povidone-Iodine or Chlorhexidine Scrub | Provides broad-spectrum antisepsis for the surgical field, critical for survival procedures. |
| Sterile, Single-Use Drapes & Gowns | Maintains the aseptic surgical field, preventing contamination from the non-sterile environment. |
| Cytokine ELISA Kits (e.g., for IL-1β, TNF-α, IL-6) | Quantifies acute inflammatory response to the implant, a key metric of initial trauma. |
| Microbial Culture Media (Blood Agar, TSB) | Enables diagnosis and identification of infectious contaminants from explants or swabs. |
| Isoflurane/Oxygen Vaporizer | Provides safe, controllable, and reversible anesthesia, minimizing stress-related immune response. |
Troubleshooting Guides & FAQs
Q1: During in vivo testing of a dexamethasone-eluting neural probe, we observe a sharp drop in drug release kinetics after the first week, contrary to the planned sustained release profile. What could be the cause? A: This is a common abiotic failure mode often related to polymer crystallization or coating delamination. The initial burst release depletes the surface-accessible drug, while the core becomes inaccessible. Ensure your PLGA or PLLA coating is optimized for the specific molecular weight and lactide:glycolide ratio. A rapid solvent evaporation process during dip-coating can create a dense, impermeable skin layer. Troubleshooting Steps: 1) Characterize coating morphology via SEM for cracks or dense skin layers. 2) Switch to a slower, controlled evaporation solvent (e.g., dichloromethane vs. chloroform). 3) Incorporate hydrophilic porogens (e.g., PEG) at 5-10% w/w to create release channels. 4) Consider a multi-layer coating approach with a drug-free barrier layer to modulate initial burst.
Q2: Our anti-inflammatory peptide (e.g., α-MSH) loaded into a hydrogel coating shows bioactivity loss upon implantation, failing to mitigate glial scarring. How can we stabilize the therapeutic agent? A: This is a biotic failure mode where the peptide degrades in the inflammatory, enzymatic microenvironment. The hydrogel matrix may not provide sufficient protection. Troubleshooting Steps: 1) Use protease inhibitors (e.g., aprotinin) co-encapsulated at 0.1 mM concentration within the hydrogel. 2) Modify the peptide sequence with D-amino acids to enhance enzymatic stability. 3) Switch the carrier to a more protective system like poly(lactic-co-glycolic acid) (PLGA) microparticles embedded within the hydrogel. 4) Pre-test bioactivity in an in vitro assay with activated microglial cell supernatant to simulate inflammatory conditions.
Q3: When co-delivering an antioxidant (Resveratrol) and an anti-inflammatory (Dexamethasone) from the same electrode coating, we see unexpected precipitation and heterogeneous coating. How can we achieve stable co-loading? A: This is a formulation incompatibility issue. Dexamethasone phosphate (hydrophilic) and resveratrol (hydrophobic) have opposing solubility profiles, leading to phase separation. Troubleshooting Steps: 1) Use separate carrier phases: Load dexamethasone-P in a hydrophilic hydrogel (e.g., Hyaluronic acid) and resveratrol in PLGA nanoparticles, then combine layers. 2) Employ a dual-emulsion solvent evaporation technique (W/O/W) for microsphere formation to encapsulate both. 3) Chemically conjugate resveratrol to a polymer backbone to improve compatibility. 4) Characterize with Differential Scanning Calorimetry (DSC) to check for separate melting points, indicating phase separation.
Q4: Our drug-eluting microfluidic channel on a neural probe is consistently clogging post-implantation. How can we maintain patency? A: Clogging is a critical biotic/abiotic failure mode caused by protein adsorption and cellular infiltration. Troubleshooting Steps: 1) Implement a daily, low-pressure backflush protocol with artificial cerebrospinal fluid (aCSF) if the system is closed-loop. 2) Surface-modify the microchannel with a non-fouling coating like zwitterionic polymer (e.g., poly(sulfobetaine methacrylate)) prior to drug loading. 3) Include an anti-coagulant (e.g., heparin at 0.1 IU/mL) in the drug formulation. 4) Reduce channel diameter to <50 µm to leverage laminar flow dominance, but increase number of channels for redundancy.
Q5: How do we accurately measure the local concentration of a released neuroprotective agent (e.g., GDNF) in the brain tissue surrounding the implant? A: Direct in vivo measurement is challenging. Use a combination of indirect methods. Recommended Protocol: 1) In Vitro Calibration: Establish a correlation between release rate and a measurable signal (e.g., electrochemical oxidation current for certain drugs) using a microsensor. 2) Microdialysis: Place a microdialysis probe adjacent to the implant and analyze dialysate with ELISA. Correction for recovery rate (typically 10-20% for brain tissue) is mandatory. 3) Post-mortem Immunohistochemistry: Quantify the spread and intensity of biomarker (e.g., p-ERK for GDNF activity) in concentric circles from the implant site. 4) Radio-labeling: Use ³H- or ¹⁴C-labeled drug forms and perform autoradiography on brain slices.
Experimental Protocols
Protocol 1: Accelerated Release Kinetics Testing for Polymer Coatings Objective: To predict long-term (4-week) drug release profile from a polymer-coated electrode in a reduced timeframe (7 days).
- Prepare your drug-loaded polymer-coated neural probe samples (n=5).
- Place each sample in a sealed vial with 1 mL of phosphate-buffered saline (PBS) pH 7.4 + 0.02% sodium azide (preservative).
- Incubate in a shaking water bath at 37°C and 60 oscillations per minute.
- At predetermined time points (1h, 4h, 8h, 1d, 2d, 4d, 7d), remove the entire release medium and replace with fresh, pre-warmed PBS.
- Analyze the collected medium for drug concentration using HPLC-UV/VIS. Use a C18 column, mobile phase tailored to your drug's hydrophobicity.
- Plot cumulative release (%) vs. time. An accelerated profile is indicated by >80% release within 7 days for a system designed to last 4 weeks.
Protocol 2: Evaluating Anti-inflammatory Efficacy in a Glial Cell Culture Model Objective: To assess the ability of a drug-eluting coating to suppress activated astrocyte and microglial responses in vitro.
- Cell Seeding: Seed murine BV-2 microglia or primary astrocytes in a 24-well plate (50,000 cells/well). Grow to confluence in complete DMEM.
- Sample Application: Place your sterile drug-eluting implant material or conditioned medium from it into a transwell insert above the cells.
- Activation Challenge: Add Lipopolysaccharides (LPS) at 100 ng/mL to the culture medium to induce inflammation.
- Control Groups: Include (a) negative control (no LPS, no implant), (b) inflammation control (LPS, no drug), (c) experimental (LPS + drug-eluting material).
- Incubation: Incubate for 48 hours at 37°C, 5% CO₂.
- Analysis:
- ELISA: Collect supernatant and measure TNF-α (microglia) or GFAP (astrocytes) concentration.
- Viability: Perform an MTT assay to ensure effects are not due to cytotoxicity.
- Imaging: Fix cells and immunostain for Iba1 (microglia) or GFAP (astrocytes); quantify cell morphology and fluorescence intensity.
Data Presentation
Table 1: Common Drug-Carrier Systems for Neural Interfaces
| Carrier System | Exemplary Loaded Agent(s) | Typical Load (% w/w) | Release Duration (Target) | Key Advantage | Primary Failure Mode |
|---|---|---|---|---|---|
| PLGA Coating | Dexamethasone, Ibuprofen | 10-30% | 1-4 weeks | Tunable degradation, FDA-approved | Acidic degradation products, burst release |
| Hydrogel (Alginate) | BDNF, Anti-TNF-α Ab | 1-5% | 3-10 days | High biocompatibility, gentle encapsulation | Rapid dissolution, poor mechanical strength |
| Mesoporous Silica | Resveratrol, Minocycline | 20-40% | 2-6 weeks | High surface area, precise pore size | Brittleness, non-degradable |
| Lipid Nanocapsules | FK506, Curcumin | 5-15% | 1-2 weeks | Enhanced CNS penetration, cell membrane fusion | Low loading, stability issues in vivo |
Table 2: Troubleshooting Matrix for Failure Modes
| Observed Problem | Likely Type (Biotic/Abiotic) | Immediate Diagnostic Test | Probable Root Cause | Corrective Action |
|---|---|---|---|---|
| No drug release | Abiotic | SEM of coating; HPLC of soak solution | Overly dense/impermeable polymer matrix | Modify coating parameters; add porogen. |
| Bioactivity loss in vivo | Biotic | In vitro bioassay with enzymes | Proteolytic/oxidative degradation of therapeutic | Use stabilized analogs or protease inhibitors. |
| Unplanned burst release | Abiotic | Cumulative release plot (first 24h) | High surface drug concentration, coating cracks | Apply drug-free barrier layer; slow drying. |
| Increased electrode impedance | Both | EIS in aCSF at 1 kHz | Protein/cell fouling on electrode surface | Co-deliver anti-fouling agent (e.g., heparin). |
| Local tissue toxicity | Both | Histology (H&E) at 7 days post-implant | Degradation product buildup (e.g., acidic PLGA) | Switch to more biocompatible polymer (e.g., PCL). |
Diagrams
Title: Therapeutic Intervention on the Foreign Body Response Pathway
Title: Formulation Workflow for Co-loaded Drug Coatings
The Scientist's Toolkit: Research Reagent Solutions
| Item/Category | Example Product/Specification | Function in Integration Research |
|---|---|---|
| Biodegradable Polymer | Poly(D,L-lactide-co-glycolide) (PLGA), 50:50, MW 24,000-38,000 | Forms the primary drug-eluting matrix on the electrode; degradation rate controls release duration. |
| Hydrogel Precursor | Methacrylated Hyaluronic Acid (MeHA), 1-2% w/v in PBS | Creates a soft, hydrating, biocompatible coating for delicate biomolecules (peptides, antibodies). |
| Porogen | Poly(ethylene glycol) (PEG), MW 1,000, 10% w/w of polymer | Added to polymer solutions to create pores upon dissolution, modulating drug release kinetics. |
| Protease Inhibitor Cocktail | Aprotinin (100 µg/mL), Leupeptin (10 µM) | Co-encapsulated to protect therapeutic peptides from degradation in the inflammatory milieu. |
| Surfactant for Emulsification | Poly(vinyl alcohol) (PVA), 1-3% w/v in water | Stabilizes the oil-water interface during single/double emulsion fabrication of drug-loaded microparticles. |
| Crosslinker | N,N'-Methylenebisacrylamide (BIS), 0.1% molar ratio | Chemically crosslinks hydrogel networks (e.g., based on alginate or PEGDA) for mechanical stability. |
| Fluorescent Tracer | FITC-Dextran, 70 kDa, 0.1% w/w | Mixed with the drug to visually track release distribution in vitro or in tissue sections. |
| ELISA Kit | Mouse/Rat TNF-α or GFAP Quantikine ELISA | Gold-standard for quantifying inflammatory biomarker levels in cell media or tissue homogenates. |
| Artificial CSF | aCSF (pH 7.4) containing NaCl, KCl, NaHCO₃, MgCl₂, CaCl₂, Glucose | Physiological medium for in vitro release and impedance testing, simulating brain extracellular fluid. |
| Impedance Testing Electrolyte | PBS or 0.9% NaCl solution | Standard solution for performing electrochemical impedance spectroscopy (EIS) on coated electrodes. |
Diagnosis and Repair: Strategies to Monitor, Maintain, and Salvage Electrode Performance
In Vivo Electrochemical Impedance Spectroscopy (EIS) as a Diagnostic Tool
Technical Support Center
Troubleshooting Guide
Issue 1: Unstable or Drifting Impedance Measurements During Chronic Recording.
| Symptom | Possible Cause | Recommended Action |
|---|---|---|
| Low-frequency impedance (1-10 Hz) shows monotonic increase over days/weeks. | Progressive biotic failure: Glial scar formation (astrogliosis, microgliosis) insulating the electrode. | Confirm via post-hoc histology (GFAP, Iba1 staining). Consider anti-inflammatory drug elution or softer electrode materials. |
| High-frequency impedance (1 kHz) shows sudden, persistent increase. | Abiotic failure: Insulation breach or conductive layer delamination. | Perform cyclic voltammetry in a safe window (e.g., -0.6V to 0.8V vs. Ag/AgCl) to check for reduced charge storage capacity. |
| Wideband noise and erratic impedance values. | Loose connector or compromised reference/counter electrode. | Check all physical connections. Re-test with a fresh, stable reference electrode (e.g., new Ag/AgCl wire). |
| Impedance drops sharply at all frequencies. | Abiotic failure: Electrode short circuit due to cracked insulation. | Inspect under microscope. The electrode is likely non-functional for recording/stimulation. |
Issue 2: Inconsistent EIS Data Between Pre-Implantation Bench Tests and In Vivo Measurements.
| Symptom | Possible Cause | Recommended Action |
|---|---|---|
| In vivo impedance magnitude is higher than bench test in PBS. | Expected biotic component: Presence of tissue and cells increases resistance. | Establish a new post-implantation baseline (e.g., 24 hrs after implantation). Track changes from this baseline. |
| Phase angle profile is radically different. | Non-ideal reference electrode impedance in vivo. | Use a low-impedance, stable reference (e.g., skull screw or large surface area Ag/AgCl). Ensure it is placed in relevant tissue compartment. |
| Cannot fit data to equivalent circuit model. | The simple Randles cell model is insufficient for tissue interface. | Use a modified model (e.g., with constant phase element (CPE) and Warburg diffusion element). See protocol below. |
Issue 3: Animal Movement or Stimulation Artifacts Corrupting EIS.
| Symptom | Possible Cause | Recommended Action |
|---|---|---|
| Large spikes or transients in the impedance time-series. | Motion-induced changes in electrode-tissue contact or cable sway. | Use a head-mounted, miniaturized EIS system to reduce cable movement. Secure the headcap and connector firmly. |
| EIS sweep coincides with stimulation pulse. | Stimulation artifact saturating the potentiostat. | Program a delay between stimulation and EIS measurement. Use a potentiostat with fast recovery from saturation. |
Frequently Asked Questions (FAQs)
Q1: What is the optimal frequency range for diagnosing neural electrode failure modes? A: A broad spectrum (0.1 Hz to 100 kHz) is critical.
- 0.1 - 10 Hz: Sensitive to diffusion processes and progressive biotic encapsulation (glial scar).
- 10 Hz - 1 kHz: Contains information about tissue resistance and electrode surface properties.
- 1 kHz - 10 kHz: The canonical "1 kHz impedance" often used to track abiotic failures (insulation breach) and electrode health.
- >10 kHz: Related to solution/fluid resistance and capacitive coupling.
Q2: How do I differentiate a biotic failure signal from an abiotic one using EIS? A: Monitor the frequency-dependent trends over time. Key differentiators are summarized in the table below.
| Failure Mode | Typical EIS Signature Over Time | Key Frequency Range | Corresponding Equivalent Circuit Change |
|---|---|---|---|
| Biotic (Encapsulation) | Low-freq impedance (Z) increases. Phase shift at mid-frequencies increases. | 0.1 - 100 Hz | Increase in the resistance of the tissue encapsulation layer (Rencap). |
| Abiotic (Insulation Crack) | High-freq impedance (Z) decreases. Capacitive phase roll-off diminishes. | 1 - 10 kHz | Decrease in the insulation capacitance (Cinsul) or shunt resistance. |
| Abiotic (Conductor Break) | Impedance at all frequencies increases sharply. | All frequencies | Dramatic increase in the solution access resistance (Rs) and charge transfer resistance (Rct). |
Q3: What equivalent circuit model should I use to fit my in vivo EIS data? A: The standard Randles circuit (Rs + Cdl//(Rct+W)) is often insufficient. A more robust model for a chronically implanted microelectrode is:
R<sub>s</sub> (Solution/Tissue Resistance) + CPE<sub>encap</sub>//R<sub>encap</sub> (Encapsulation Layer) + CPE<sub>dl</sub>//(R<sub>ct</sub> + W) (Electrode Double Layer)
Protocol for EIS Data Fitting:
- Acquire Data: Measure EIS from 0.1 Hz to 100 kHz at a low AC amplitude (e.g., 10 mV RMS) around the open-circuit potential.
- Initial Model: Start with the modified circuit above in fitting software (e.g., ZView, EC-Lab).
- Replace Capacitors with CPEs: Use Constant Phase Elements (CPEs) to account for non-ideal, distributed capacitance from rough surfaces and tissue heterogeneity.
- Constrain Values: Constrain Rs to a plausible range (e.g., 0.5 - 2 kΩ for a microelectrode). The CPE exponent 'n' should be between 0.7 (porous/rough) and 1 (perfect capacitor).
- Iterative Fitting: Fit first to the high-frequency data (>1 kHz) to get Rs and initial CPEdl estimates, then fit the full spectrum.
Q4: Can EIS be performed simultaneously with neural recording or stimulation? A: With careful design.
- Recording: Possible if the EIS AC signal is outside the neural signal band (300 Hz - 6 kHz). Use a high-pass filter on the recording amplifier.
- Stimulation: Not simultaneously. EIS must be performed during quiescent periods. Apply stimulation pulses in bursts, with dedicated, artifact-free time windows for EIS measurement.
Experimental Protocol: ChronicIn VivoEIS Monitoring for Failure Mode Analysis
Objective: To longitudinally track biotic and abiotic failure modes of an implanted microelectrode array in a rodent model.
Materials:
- Microelectrode array (e.g., Michigan or Utah style).
- Potentiostat/Galvanostat with EIS capability.
- Headstage commutator to reduce cable torque.
- Rodent stereotaxic setup.
- Stable reference electrode (e.g., Ag/AgCl skull screw).
- Data acquisition software.
Procedure:
- Pre-Implantation Bench Characterization:
- Sterilize the array.
- In 1x PBS, perform EIS (0.1 Hz - 100 kHz, 10 mV RMS) and Cyclic Voltammetry (CV, -0.6V to 0.8V, 50 mV/s) for each electrode. Record baseline impedance magnitude/phase and charge storage capacity (CSC).
Surgical Implantation:
- Implant the array and reference electrode in the target brain region using standard aseptic techniques.
- Fix the connector to the skull with dental acrylic.
Chronic In Vivo EIS Monitoring:
- Day 0 (Acute): 1 hour post-surgery, perform EIS measurements.
- Days 1, 3, 7, 14, 30...: Under brief anesthesia or habituated restraint, connect the headstage.
- At each time point: a. Measure the open-circuit potential (OCP). b. Perform EIS sweep at OCP. c. (Optional) Perform CV to calculate CSCc.
- Record neural recording quality (SNR, unit yield) concurrently if possible.
Terminal Analysis:
- Perfuse and fix the brain.
- Perform immunohistochemistry (GFAP, Iba1, NeuN) to quantify glial scar and neuronal density.
- Correlate histological metrics with the temporal evolution of EIS parameters (e.g., low-frequency impedance vs. glial scar thickness).
Visualizations
Diagram 1: In Vivo EIS Diagnostic Decision Workflow
Diagram 2: EIS Circuit Model Evolution with Failure Modes
The Scientist's Toolkit: Key Research Reagent Solutions
| Item | Function in EIS Diagnostics | Example/Note | ||
|---|---|---|---|---|
| Phosphate Buffered Saline (PBS) | Pre-implantation electrochemical baseline measurement. Provides consistent ionic strength. | 0.1M, pH 7.4, for sterile bench testing. | ||
| Anti-inflammatory Agents (e.g., Dexamethasone) | Used to mitigate biotic failure. Can be coated on or eluted from electrodes to suppress gliosis. | Critical for studies isolating abiotic failure. | ||
| Immunohistochemistry Antibodies (GFAP, Iba1) | Post-mortem validation of biotic failure modes. Quantifies astrocytic and microglial encapsulation. | Gold standard for correlating EIS trends with histology. | ||
| Conductive Polymer Coatings (e.g., PEDOT:PSS) | Used to lower electrode impedance and improve charge injection. Their degradation can be monitored via EIS. | PEDOT degradation often shows as a gradual increase in | Z | at 1 kHz. |
| Artificial Cerebrospinal Fluid (aCSF) | More physiologically relevant than PBS for ex vivo testing of explanted devices. | |||
| Numeric Fitting Software (e.g., ZView, EC-Lab) | Essential for fitting EIS spectra to equivalent circuit models to extract physical parameters. | Enables quantitative tracking of Rencap, Cdl, etc. |
Technical Support Center: Troubleshooting Guides & FAQs
FAQ: Common Signal Degradation Issues
Q1: My recorded neural signals show a gradual decline in signal-to-noise ratio (SNR) over a 4-week chronic implant period. What algorithmic post-processing steps can I apply? A1: This is indicative of abiotic failure (e.g., biofilm encapsulation) and biotic failure (glial scarring). Post-processing can involve:
- Adaptive Filtering: Use a recursive least squares (RLS) adaptive filter to dynamically estimate and subtract the increasing low-frequency noise component caused by rising electrode impedance.
- Blind Source Separation: Apply algorithms like Independent Component Analysis (ICA) to isolate neuronal signals from non-physiological noise sources.
- Wavelet Denoising: Employ wavelet transform thresholds to remove noise in specific frequency bands without distorting spike waveforms.
Q2: How can I compensate for the loss of high-frequency spike content in my recordings, which is critical for single-unit isolation? A2: High-frequency attenuation often results from increased capacitive shunting due to gliosis. Compensation techniques include:
- Inverse Filtering: Construct an inverse filter based on the estimated transfer function of the degraded electrode-tissue interface to restore frequency components.
- Template Matching & Deconvolution: Use a Wiener deconvolution approach with a known or estimated spike template to sharpen recorded waveforms.
Q3: Sudden signal dropouts or large amplitude shifts are occurring in my multi-electrode array data. How can I algorithmically identify and handle these artifacts? A3: These are likely caused by abiotic mechanical failure (lead wire breakage) or unstable biofouling. Implement:
- Artifact Rejection via Thresholding: Automatically flag segments where signal amplitude exceeds a physiologically plausible range (e.g., > ±2 mV).
- Channel Correlation Analysis: Identify dead channels by calculating cross-correlation with neighboring channels; a near-zero correlation suggests failure.
- Interpolation: For a temporarily dropped channel, use spatial interpolation from functioning adjacent channels to estimate missing data, though with caution for unit-specific analysis.
Q4: What metrics should I use to quantitatively assess the performance of my compensation algorithm on degraded signals? A4: Always compare processed signals to baseline (Day 1) recordings or use ground-truth simulations.
| Metric | Formula / Description | Target |
|---|---|---|
| Signal-to-Noise Ratio (SNR) | SNR (dB) = 20 log₁₀( Asignal / Anoise ) | Maximize. Compare pre- vs. post-processing. |
| Mean Squared Error (MSE) | MSE = (1/N) Σ (xoriginal - xprocessed)² | Minimize (vs. known clean signal). |
| Spike Sorting Yield | # of well-isolated single units / total # of channels | Restore towards initial yield. |
| Spectral Coherence | Frequency-domain correlation between pre-degradation and processed signal. | Approach 1.0 for physiological bands. |
Experimental Protocol: Validating Algorithmic Compensation
Title: In Vivo/In Silico Protocol for Evaluating Post-Processing on Abiotically Degraded Signals.
Objective: To quantify the efficacy of inverse filtering and wavelet denoising in restoring spike waveforms from signals artificially degraded to mimic biofouling.
Materials & Procedure:
- Acquire Baseline Data: Record 30 minutes of spontaneous neural activity (e.g., cortical LFP and spikes) from a healthy, stable implant (Rat, Day 7 post-implant).
- Create Degraded Dataset: Simulate abiotic degradation by applying a digital low-pass filter (cutoff: 3 kHz, roll-off: 24 dB/octave) and adding Gaussian noise to the baseline data to reduce SNR by 10 dB. This models increased impedance and thermal noise.
- Apply Compensation Algorithms:
- Path A (Inverse Filter): Estimate the impulse response of the simulated degradation filter. Design and apply an inverse Wiener filter.
- Path B (Wavelet Denoising): Apply a stationary wavelet transform (Symlet 4, level 5), use a minimax threshold rule for detail coefficients, reconstruct signal.
- Quantitative Analysis: For both original (clean), degraded, and two processed signals, calculate the metrics in the table above. Perform spike sorting (e.g., MountainSort) on all four datasets and compare unit count and waveform shape.
The Scientist's Toolkit: Research Reagent Solutions for Neural Interface Studies
| Item | Function | Example Use-Case |
|---|---|---|
| Conductive Polymer Coating (PEDOT:PSS) | Reduces electrochemical impedance, improves charge injection limit. | Coating microelectrodes to combat signal degradation from abiotic fouling. |
| Anti-Inflammatory Drug (Dexamethasone) | Modulates biotic response by suppressing glial activation and inflammation. | Eluted from electrode coating to mitigate glial scarring and signal loss. |
| Neuronal Adhesion Molecule (L1) | Promotes neuron-electrode integration, enhances intimate coupling. | Functionalized on electrode surface to improve long-term SNR. |
| Fluorescent Calcium Indicators (GCaMP) | Optical readout of neural activity, validates electrophysiological signals. | Benchmarking the performance of electrical signal compensation algorithms. |
| Silicone Elastomer (PDMS) | Provides flexible, biocompatible insulation for chronic implants. | Reducing mechanical mismatch (abiotic failure) at the neural tissue interface. |
Visualization: Algorithmic Compensation Workflow
Title: Post-Processing Signal Compensation Workflow
Visualization: Biotic & Abiotic Failure Pathways Impacting Signals
Title: Signal Degradation Pathways from Electrode Failures
Technical Support Center
Troubleshooting Guide & FAQs
Q1: During chronic stimulation in my rodent model, I observe a significant increase in electrode impedance and a decline in signal quality after two weeks. What could be the cause and how can I address it?
A1: This is a classic sign of abiotic (electrode) and biotic (tissue) failure modes. The increased impedance likely stems from protein fouling and glial encapsulation (biotic), potentially accelerated by electrochemical by-products from stimulation (abiotic). To troubleshoot:
- Check Charge Injection Limits: Ensure your stimulation parameters are within the safe charge injection limit of your electrode material. Refer to Table 1.
- Optimize Waveform: Immediately switch to cathodic-first, charge-balanced biphasic pulses. This minimizes net charge delivery and reduces harmful faradaic reactions.
- Protocol Adjustment: Reduce your charge density per phase and re-evaluate the efficacy of a lower amplitude/longer pulse width combination. Implement a daily impedance monitoring protocol to track changes.
Q2: How do I determine the maximum safe charge injection for my specific electrode design before starting an experiment?
A2: Safe charge injection is determined by the water window of your electrode material and its surface area. You must calculate it empirically.
- Experimental Protocol (Cyclic Voltammetry for Charge Storage Capacity):
- Setup: Use a three-electrode cell (your working electrode, a Pt counter electrode, and a Ag/AgCl reference electrode) in phosphate-buffered saline (PBS) at 37°C.
- Scan: Run a cyclic voltammogram (CV) at a slow scan rate (e.g., 50 mV/s) between the established anodic and cathodic potential limits for your material (see Table 1). Do not exceed potentials that cause water hydrolysis.
- Calculate: Integrate the cathodic current over time in the CV. The Cathodic Charge Storage Capacity (CSCc) is calculated as: CSCc = (1 / scan rate) × ∫ |I| dV. This value (in mC/cm²) is a key metric for safe charge injection.
- Safety Margin: The maximum safe charge per phase (Qph) for stimulation is typically set at ≤ 10-20% of the CSCc. Calculate your charge density: Qd = Qph / (electrode geometric surface area).
Q3: What are the key stimulation parameters I should optimize to minimize tissue damage, and what is the evidence?
A3: The primary goal is to minimize the charge density at the electrode-tissue interface. The seminal work by McCreery et al. (1990) established the relationship between charge density per phase and neural damage. Key parameters and their roles are summarized below.
Table 1: Key Stimulation Parameters & Safe Limits for Common Materials
| Parameter | Definition & Impact | Typical Safe Range (Chronic) | Material-Specific Notes |
|---|---|---|---|
| Charge Density per Phase (Qd) | Charge per phase / electrode area. Primary predictor of damage. | ≤ 30-40 µC/cm² for Pt. ≤ 100-150 µC/cm² for IrOx. | McCreery's threshold for Pt damage: ~40 µC/cm². Must be derived from CSCc. |
| Charge per Phase (Qph) | Amplitude × Pulse Width. Total charge delivered. | Varies with electrode size. | Keep Qph as low as functionally possible. |
| Pulse Width (PW) | Duration of each stimulation phase. Affects recruitment and voltage transients. | 50-200 µs. | Longer PW allows lower amplitude for same Qph, reducing voltage swings. |
| Interphase Delay | Time between cathodic and anodic phases. Allows charge recovery. | 50-200 µs. | Critical for ensuring true charge balance with non-ideal capacitors. |
Table 2: Electrochemical Properties of Common Electrode Coatings
| Material | Charge Storage Capacity (CSCc) (approx.) | Primary Charge Injection Mechanism | Key Advantage for Safety |
|---|---|---|---|
| Platinum (Pt) | 1-3 mC/cm² | Capacitive + Reversible Faradaic (H adsorption) | Well-established, stable. |
| Iridium Oxide (IrOx) | 20-100+ mC/cm² | Capacitive + Reversible Faradaic (oxide redox) | High CSCc allows safer higher Qd. |
| PEDOT:PSS | 50-200+ mC/cm² | Capacitive + Ionic Exchange | Low impedance, high CSCc. Long-term stability concerns. |
| Titanium Nitride (TiN) | 5-15 mC/cm² | Primarily Capacitive | Very robust and stable. |
Q4: Can you provide a standard workflow for establishing a safe stimulation protocol for a new electrode array?
A4: Yes. Follow this experimental workflow to systematically determine safe parameters.
Diagram Title: Safe Stimulation Protocol Development Workflow
Q5: What are the essential materials and reagents needed for this optimization research?
A5: Research Reagent Solutions & Essential Materials
| Item | Function & Rationale |
|---|---|
| Potentiostat/Galvanostat | For performing CV and Electrochemical Impedance Spectroscopy (EIS) to characterize electrodes and determine CSCc. |
| Three-Electrode Cell Setup | Includes a Ag/AgCl reference electrode and Pt counter electrode for accurate electrochemical testing in PBS. |
| Phosphate-Buffered Saline (PBS), 0.1M, pH 7.4 | Standard electrolyte for in vitro electrochemical testing, mimicking physiological ionic strength. |
| Programmable Multichannel Stimulator | For delivering precise, charge-balanced biphasic pulses with controllable amplitude, pulse width, and frequency. |
| Current-Controlled Stimulation Headstage | Preferred over voltage-controlled to directly manage charge injection and prevent unsafe voltage transients. |
| Microelectrode Arrays (with various coatings) | Test substrates: Pt, IrOx, PEDOT:PSS, TiN. Coating dictates safe charge injection limits. |
| Histology Reagents (e.g., antibodies for GFAP, Iba1, NeuN) | For post-chronic study tissue analysis to quantify gliosis and neuronal loss around the electrode site. |
Troubleshooting Guides & FAQs
Q1: How can I detect and quantify micro-cracks in my neural electrode's insulation (e.g., Parylene C, silicone) before implantation? A: Proactive inspection is key. Use high-resolution microscopy and electrochemical impedance spectroscopy (EIS).
- Protocol: Perform EIS in a standard saline solution (e.g., PBS, 0.9% NaCl) from 1 Hz to 100 kHz at a low amplitude (10 mV). A significant drop in impedance magnitude at low frequencies (e.g., below 100 Hz) is indicative of insulation failure, as the conductive solution penetrates cracks.
- Data: Compare to baseline impedance of a pristine electrode.
| Insulation State | Low-Freq (1-10 Hz) Impedance Magnitude | Phase Angle at 1 kHz |
|---|---|---|
| Pristine | High (>1 GΩ) | Close to -90° (capacitive) |
| Micro-crack Present | Drastically reduced (e.g., <10 MΩ) | Shifts toward 0° (resistive) |
Q2: My chronically implanted metal electrode (e.g., Michigan array, Utah array) shows degraded performance. How do I determine if electrode dissolution is the cause? A: Post-explant material analysis is necessary to confirm dissolution.
- Protocol: After explant, analyze the electrode sites using:
- Scanning Electron Microscopy (SEM): For topographical changes like pitting or thinning.
- Energy-Dispersive X-ray Spectroscopy (EDS): To detect changes in elemental composition and trace dissolution products on the surface.
- Inductively Coupled Plasma Mass Spectrometry (ICP-MS): On digested tissue surrounding the implant site to quantify dissolved metal ions (e.g., Pt, Ir, W).
- Data: Typical dissolution rates for noble metals under neural stimulation.
| Electrode Material | Typical Dissolution Rate (ng/C) | Common Stimulation Limit for Safety |
|---|---|---|
| Platinum (Pt) | 1 - 10 | ~0.35–0.5 mC/cm² per phase |
| Iridium Oxide (IrOx) | 0.1 - 1 | >1 mC/cm² per phase |
| Activated Iridium Oxide (AIROF) | ~0.05 | >3 mC/cm² per phase |
Q3: My recording/stimulation thresholds are increasing over time. What are the primary abiotic vs. biotic factors, and how can I isolate them? A: High and rising thresholds signal failure. Systematic testing is required to decouple causes.
| Potential Cause | Abiotic/Biotic | Diagnostic Test |
|---|---|---|
| Insulation Crack / Delamination | Abiotic | EIS (see Q1). Cyclic Voltammetry (CV): Drastic increase in charge storage capacity (CSC) can indicate exposed substrate. |
| Electrode Dissolution / Fouling | Primarily Abiotic | CV: Decrease in CSC and reversible redox peaks. SEM/EDS post-explant. |
| Encapsulating Glial Scar | Biotic | Histology: Immunostaining for GFAP (astrocytes), Iba1 (microglia). In vivo: Gradual threshold increase correlated with reduced neuronal density nearby. |
| Neuronal Loss | Biotic | Histology: Nissl stain, NeuN staining to count neurons at increasing distances from the electrode track. |
Q4: What is a robust experimental workflow to systematically investigate these failure modes in a single study? A: An integrated pre-/post-explant protocol is essential.
Diagram Title: Integrated Workflow for Electrode Failure Analysis
The Scientist's Toolkit: Research Reagent Solutions
| Item | Function in Failure Analysis |
|---|---|
| Phosphate Buffered Saline (PBS) | Standard electrolyte for in vitro EIS and CV testing to simulate physiological conditions. |
| Artificial Cerebrospinal Fluid (aCSF) | More physiologically relevant solution for pre-implant in vitro testing. |
| Paraformaldehyde (PFA, 4%) | Standard fixative for perfusing and preserving neural tissue for histology post-explant. |
| Anti-GFAP Antibody | Primary antibody for immunohistochemical labeling of reactive astrocytes in the glial scar. |
| Anti-Iba1 Antibody | Primary antibody for labeling activated microglia/macrophages in the immune response. |
| NeuN Antibody | Primary antibody for labeling neuronal nuclei to assess neuronal density and loss. |
| Aqua Regia (3:1 HCl:HNO₃) | Strong oxidizing acid for digesting explanted electrodes or tissue samples prior to ICP-MS analysis of metal content. |
| Ferricyanide Solution ([Fe(CN)₆]³⁻/⁴⁻) | Redox couple used in benchmark CV scans to measure changes in electrode electroactive surface area over time. |
Technical Support Center
Troubleshooting Guide & FAQs
Q1: During chronic in vivo recording, we observe a steady increase in electrode impedance over several weeks. What are the primary causes and potential countermeasures?
A: A steady impedance rise typically indicates a biotic failure mode: the foreign body response (FBR). This involves protein adsorption, glial scar formation (astrogliosis), and microglial encapsulation, which insulate the electrode.
- Immediate Check: Perform electrochemical impedance spectroscopy (EIS) to differentiate between component failure (e.g., wire break) and tissue encapsulation. A uniform increase across frequencies suggests tissue encapsulation.
- Protocol - Mitigating FBR via Drug Elution:
- Coating Preparation: Prepare a solution of 10 mg/mL Poly(lactic-co-glycolic acid) (PLGA) in dichloromethane.
- Drug Loading: Add anti-inflammatory agent (e.g., Dexamethasone) at 10% (w/w) to polymer.
- Dip-Coating: Slowly dip the electrode in the solution, withdraw at 1 mm/sec, and air-dry for 24 hrs.
- In Vitro Release Test: Immerse coated electrode in 1x PBS at 37°C, collecting supernatant at intervals for HPLC analysis to characterize release kinetics.
Q2: Our flexible polymer-based electrodes show mechanical failure (delamination, fracture) after 2-3 months of implantation. How can we improve abiotic stability?
A: This is a classic abiotic failure due to mechanical mismatch and fatigue at the bio-interface.
- Immediate Check: Use scanning electron microscopy (SEM) on explanted devices to identify failure loci (often at the conductor-polymer junction).
- Protocol - Accelerated Aging for Mechanical Reliability:
- Hydration Testing: Submerge devices in PBS at 60°C for 7 days (accelerates hydrolytic degradation).
- Cyclic Bending: Use a motorized stage to subject the electrode to 100,000 bend cycles at a radius matching the implantation site (e.g., 5mm radius for cortical surface).
- Post-Test Analysis: Measure impedance pre- and post-test. Inspect for cracks and delamination. Functional metal traces should show <10% impedance change to pass.
Q3: We are experiencing signal attenuation and loss of single-unit yield. What monitoring protocol can distinguish between biotic (cell death) and abiotic (electrode fouling) causes?
A: Implement a multimodal monitoring protocol.
- Immediate Action: Simultaneously record neural signals (spikes, LFP) and measure charge transfer capacity (CSC) via cyclic voltammetry.
- Protocol - Weekly Stability Assessment:
- Signal Metrics: Calculate signal-to-noise ratio (SNR) and single-unit count from a 300s recording session.
- Electrode Metrics: Acquire CSC from a CV sweep (-0.6V to 0.8V vs. Ag/AgCl, 50 mV/s). Calculate electrochemical surface area (ECSA).
- Correlation: A drop in SNR and ECSA suggests abiotic fouling. Stable ECSA with declining SNR suggests biotic loss of viable neurons near the interface.
Q4: What are the key quantitative benchmarks for a "stable" chronic neural interface in a rodent model?
A: Stability is multidimensional. Refer to the following consolidated benchmarks from recent literature (2022-2024):
Table 1: Quantitative Benchmarks for Chronic Neural Electrode Stability (Rodent Model)
| Metric | Measurement Method | Stability Threshold | Typical Failure Value |
|---|---|---|---|
| Impedance (1 kHz) | Electrochemical Impedance Spectroscopy (EIS) | <30% variation from baseline (week 1) | Increase >100% |
| Single-Unit Yield | Spike sorting from high-pass (>300 Hz) data | >50% of channels yield units for >6 weeks | <10% of channels yield units |
| Signal-to-Noise Ratio | RMS of spike amplitude / RMS of background noise | >3 for sustained recording | <2 |
| Charge Storage Capacity | Cyclic Voltammetry (CV), -0.6V to 0.8V, 50 mV/s | >1 mC/cm² | <0.2 mC/cm² |
| Stable Recording Days | Daily functional testing | >84 days (12 weeks) considered long-term | <28 days |
Research Reagent Solutions Toolkit
Table 2: Essential Materials for Chronic Implantation Research
| Item | Function / Rationale | Example Product / Specification |
|---|---|---|
| Conductive Polymer Coating (PEDOT:PSS) | Increases effective surface area, lowers impedance, improves charge injection limit. Use for abiotic performance enhancement. | Heraeus Clevios PH1000, mixed with 3-5% Ethylene Glycol. |
| Anti-inflammatory Drug (Dexamethasone) | Mitigates biotic foreign body response. Can be incorporated into coatings for localized, sustained release. | Water-soluble prodrug (Dexamethasone sodium phosphate) for aqueous processing. |
| Soft Silicone Elastomer (PDMS) | Used as a substrate or encapsulant for flexible electrodes. Reduces mechanical mismatch with tissue. | Dow Sylgard 184, mixed at 10:1 base:curing agent for ~0.5-1 MPa modulus. |
| Neural Tissue Adhesive (Gelatin Methacryloyl) | Biocompatible hydrogel for securing implants and local drug delivery at the interface. | GelMA, 5-10% w/v, crosslinked with LAP photoinitiator under 405 nm light. |
| Fluorescent Microsphere Beads (1µm) | Used for post-mortem visualization of glial activation. Injected post-explanation to mark functional vasculature. | Invitrogen FluoSpheres, carboxylate-modified, red (580/605) fluorescence. |
| Parylene-C Deposition System | Provides a conformal, biocompatible moisture barrier for chronic insulation of microfabricated devices. | Lab-coater system ensuring >5 µm thickness with pin-hole free coating. |
Experimental Workflow & Pathway Diagrams
Title: Chronic Electrode Failure Modes Pathway
Title: Long-Term Stability Monitoring Protocol Workflow
Bench to Brain: Evaluating and Comparing Electrode Technologies and Solutions
Standardized Preclinical Models for Accelerated Failure Testing
Technical Support Center: Troubleshooting Guides & FAQs
FAQ: Biotic Failure Modes (Encapsulation & Inflammation)
Q1: During accelerated in vivo testing, my electrode impedance shows a rapid, non-asymptotic increase within 4 weeks, unlike the predicted curve. What biotic factors should I investigate?
A: This typically indicates an exacerbated foreign body response (FBR). Key troubleshooting steps:
- Check Surgical Asepsis: Review sterilization protocols for electrodes (e.g., ethylene oxide vs. autoclave) and surgical records for potential contamination.
- Analyze Accelerant Choice: If using pro-inflammatory cytokines (e.g., TNF-α, IL-1β) in your accelerated model, the concentration may be too high, leading to a non-physiological, necrotic core rather than controlled fibrosis. Titrate the dose.
- Evaluate Material Stability: The accelerated test (e.g., in oxidative saline) may have caused unexpected polymer delamination or leaching, providing a secondary biotic stimulus.
Protocol: Histological Grading of Fibrotic Encapsulation (Accelerated Model)
- Sample Prep: Perfuse-fix brain tissue with 4% PFA. Section implant site at 40µm.
- Staining: Use a multiplex immunofluorescence protocol:
- Primary Antibodies: Anti-GFAP (astrocytes), Anti-Iba1 (microglia), Anti-CD68 (activated macrophages), Anti-Col1a1 (fibroblasts/collagen).
- Secondary Antibodies: Use spectrally distinct fluorophores (e.g., Alexa Fluor 488, 555, 647).
- Quantification: Using image analysis software (e.g., ImageJ, QuPath):
- Define a concentric zone of interest (ZOI) around the electrode track (e.g., 0-50µm, 50-150µm).
- Calculate the % area positive for each marker in each ZOI.
- Apply a standardized FBR severity score (see Table 1).
Q2: My accelerated test predicts a 2-year functional lifespan, but in vivo validation shows signal drop-out at 9 months. Are my abiotic assumptions incorrect?
A: Likely yes. This discrepancy often arises from oversimplified acceleration factors. Proceed as follows:
- Re-evaluate Mechanical Stressors: The bench-top cyclic loading (e.g., 10 Hz for 1 week) may not replicate the complex, low-frequency torsional strain from chronic pulsing and micromotions. Implement a more biomimetic strain profile.
- Check Environmental Chemistry: The accelerated abiotic solution (e.g., 90°C, H2O2) may degrade materials via a different pathway (e.g., bulk hydrolysis) than the real, slow inflammatory milieu (e.g., enzymatic degradation by reactive oxygen species). Perform FTIR/XPS on explants to identify degradation products.
- Verify Multimodal Failure Interaction: Abiotic insulation crack may expose new surfaces, triggering a secondary biotic response not accounted for in the isolated accelerated tests. Use the co-culture protocol below.
Protocol: Accelerated Abiotic-Chemical Stress Test
- Solution Preparation: Prepare three accelerated aging solutions:
- A: Oxidative: 3% Hydrogen Peroxide in PBS, pH 7.4, 37°C.
- B: Acidic: PBS adjusted to pH 4.0 with HCl, 37°C.
- C: Proteolytic: 1 mg/mL Lipase + 1 mg/mL Lysozyme in PBS, 37°C.
- Procedure: Immerse electrode samples (n=5 per group) in each solution. Perform electrochemical impedance spectroscopy (EIS) daily at 1 kHz.
- Endpoint: Continue until a 200% impedance rise or visual delamination occurs. Record time-to-failure for each chemical stressor.
Q3: How can I set up an in vitro accelerated model that combines biotic and abiotic stressors?
A: Use a multi-chamber cell culture system with electrochemical capability.
- Setup: Place the electrode in a biocompatibility chamber. On one side, culture activated macrophages (e.g., THP-1 derived). On the other side, flow the abiotic stress solution (e.g., artificial cerebrospinal fluid at pH 5.0).
- Stimulation: Apply pulsed electrical stimulation (e.g., biphasic, cathodic-first, 0.2 ms pulse width, 100 Hz for 1s every 10s) to induce electrochemical stress.
- Monitoring: Use inline sensors for pH, O2, and lactate in the media. Perform EIS and cyclic voltammetry daily to track interface health.
Data Presentation
Table 1: Standardized Scoring for Accelerated Foreign Body Response
| Score | Fibrotic Capsule Thickness (µm) | Predominant Cell Type (>50%) | % Signal Amplitude Loss (vs. Baseline) |
|---|---|---|---|
| 0 | < 10 | Microglia | < 10% |
| 1 | 10 - 30 | Resting Macrophages | 10 - 25% |
| 2 | 30 - 60 | Activated Macrophages | 25 - 50% |
| 3 | 60 - 100 | FBGCs + Fibroblasts | 50 - 75% |
| 4 | > 100 | Dense Collagen Matrix | > 75% |
Table 2: Acceleration Factors for Common Preclinical Failure Modes
| Target Failure Mode | Standard In Vivo Timeline | Accelerated Model | Key Stressors | Acceleration Factor |
|---|---|---|---|---|
| Insulation Delamination | 2-4 years | Thermal-Humidity Cycling | 85°C / 85% RH | ~24x (1 month ≈ 2 yrs) |
| Metal Corrosion (Pt/Ir) | 3+ years | Potentiostatic Hold | +0.6V vs. Ag/AgCl in saline | ~36x (1 month ≈ 3 yrs) |
| Silicone Hydrolysis | 5+ years | Immersion, Elevated Temp. | PBS, 87°C | ~15x (4 months ≈ 5 yrs) |
| Fibrotic Encapsulation | 6-12 months | Cytokine Cocktail Coating | TNF-α, IL-1β on implant | ~6x (2 months ≈ 1 yr) |
Experimental Protocols
Protocol: Integrated Accelerated Failure Test (Biotic-Abiotic) Objective: To simultaneously apply mechanical, electrochemical, and inflammatory stressors.
- Apparatus: Custom bioreactor with a 3-axis micro-actuator, platinum counter electrode, Ag/AgCl reference electrode, and media perfusion.
- Electrode Preparation: Sterilize and coat test electrodes with a thin layer of collagen I (control) or collagen I spiked with 10 ng/mL IL-1β (accelerated biotic).
- Mechanical Loading: Program actuator to apply a 50 µm displacement, 1 Hz sinusoidal motion, simulating micromotion.
- Electrochemical Stress: Apply biphasic current pulses (200 µA amplitude, 200 µs pulse width) at 100 Hz in 1s bursts every 5s.
- Environment: Maintain media at 39°C (elevated temperature) and pH 6.8 (mild acidosis).
- Metrics: Record impedance at 1 kHz every hour. Sample media daily for LDH (cytotoxicity) and IL-6 (inflammation) ELISA. Terminate at 14 days for histology.
Mandatory Visualization
Diagram Title: Integrated Biotic-Abiotic Failure Pathways for Neural Electrodes
Diagram Title: Workflow for Developing Standardized Accelerated Failure Tests
The Scientist's Toolkit: Research Reagent Solutions
Table 3: Essential Materials for Accelerated Failure Testing
| Item Name & Supplier Example | Function in Accelerated Testing |
|---|---|
| Poly(3,4-ethylenedioxythiophene) Polystyrene sulfonate (PEDOT:PSS) (Heraeus Clevios) | Conductive polymer coating to benchmark electrochemical stability under accelerated pulsed stimulation. |
| Artificial Cerebrospinal Fluid (aCSF) (Sigma-Aldrich, custom mix) | Standardized ionic solution for abiotic aging tests, mimicking the brain's extracellular chemical environment. |
| Recombinant Human TNF-α & IL-1β Proteins (PeproTech) | Pro-inflammatory cytokines used to create an accelerated biotic environment on or around the implant. |
| THP-1 Human Monocyte Cell Line (ATCC) | Differentiated into macrophages for standardized in vitro cellular response testing to electrode materials. |
| Flexible Polyimide-based Microelectrode Arrays (NeuroNexus) | Common test substrate for validating mechanical failure (delamination, cracking) under cyclic strain. |
| Potentiostat/Galvanostat with EIS (Gamry Instruments, Biologic) | Critical instrument for applying electrochemical stressors and monitoring impedance/charge injection changes. |
| Matrigel Matrix (Corning) | Used to simulate a simplified, proteinaceous brain tissue environment for initial biotic response screening. |
Technical Support Center
Troubleshooting Guides & FAQs
Q1: We are experiencing a sudden, precipitous drop in signal amplitude across all channels on our chronically implanted Utah Array after several months of stable recording. What could be the cause and how can we diagnose it? A1: This is a classic sign of biotic failure, specifically the foreign body response (FBR). The drop is likely due to progressive encapsulation of the array shanks by microglia and astrocytes, increasing impedance and electrically isolating the electrodes. First, measure the electrode impedance spectrum. A significant increase, particularly at 1 kHz, confirms encapsulation. Protocol: Use your system’s impedance check function (e.g., Blackrock Microsystem’s Impedance Tester). Apply a small sinusoidal voltage (e.g., 10 mV peak-to-peak at 1 kHz) and measure the resulting current. Post-mortem histological analysis (fixation, sectioning, staining for GFAP and Iba1) is required for definitive confirmation. Mitigation strategies for future implants include coating arrays with anti-inflammatory drugs (e.g., dexamethasone) or soft hydrogel coatings.
Q2: Our Michigan-style silicon probe is mechanically fracturing at the point where it exits the cranial screw during freely moving experiments. How can we prevent this? A2: This is an abiotic mechanical failure mode due to stress concentration. The fix involves redesigning the strain relief. Protocol: Create a custom, tapered polymer (e.g., PDMS or dental acrylic) “boot” that encapsulates the probe from the brain surface to the flexible cable. The boot should be secured to the skull and the cable, allowing force to be distributed over a larger area rather than focusing on a single bend point. Ensure the flexible cable has a loose loop to absorb animal movement.
Q3: After implantation, our Neuropixels 2.0 probe shows abnormal, high-frequency noise on specific banks of channels. What steps should we take? A3: This often indicates a poor ground/reference connection or biofouling on the reference site. First, verify the integrity of your external reference wire/agar bridge connection to the system ground. Protocol: Temporarily replace the animal’s reference with a known-good saline-soaked sponge reference placed near the craniotomy. If noise disappears, the issue is with your implanted reference. For chronic implants, the integrated reference electrode may be fouled. Ensure the probe’s reference sites were properly prepared (electroplated with porous gold or PEDOT:PSS) to increase surface area and stability.
Q4: We are testing a new flexible graphene electrode. The baseline noise is excellent, but the recorded neural signals appear attenuated and low-pass filtered compared to simultaneous tungsten recordings. Is this a failure? A4: Not necessarily a failure, but a critical material-electrophysiology interface characteristic. Flexible polymer-based electrodes often have higher intrinsic capacitance but also higher impedance at relevant frequencies (≈1 kHz) due to smaller geometric surface area. This creates an RC filter. Protocol: Perform electrochemical impedance spectroscopy (EIS) from 1 Hz to 100 kHz. Plot the impedance magnitude and phase. Compare to a standard tungsten electrode. The higher impedance at 1 kHz explains the signal attenuation. Solution: Modify the graphene surface via laser patterning or deposition of platinum nanoparticles to increase the effective surface area (and thus, lower impedance).
Q5: During a long-term stimulation experiment using a Utah Array, the stimulation efficacy degrades, requiring higher voltages to elicit the same neural response. What are the potential causes? A5: This can result from both biotic and abiotic failures.
- Biotic: Electrode encapsulation (increased impedance) or neuronal death/damage near the electrode tip.
- Abiotic: Electrode corrosion or charge injection capacity (CIC) degradation. Diagnostic Protocol:
- Check impedance (rise indicates encapsulation).
- Inspect voltage transients during stimulation using an oscilloscope. A change in shape (e.g., widening of the cathodic phase) suggests a change in interfacial properties.
- Perform cyclic voltammetry (CV) on explanted arrays in PBS to assess CIC and signs of material degradation (e.g., oxidation peaks for iridium). CV Protocol: Use a potentiostat. Scan from -0.6V to 0.8V vs. Ag/AgCl at 50 mV/s. The safe charge injection limit is the integral of the cathodic or anodic current within the water window.
Comparative Data Tables
Table 1: Key Material & Performance Parameters
| Platform | Typical Material(s) | Electrode Count | Typical Impedance @ 1 kHz | Key Strengths | Primary Failure Modes |
|---|---|---|---|---|---|
| Utah Array | Silicon, Platinum/Iridium | 96-256 | 50-300 kΩ | Stable, proven, high-density | Encapsulation (Biotic), Connector failure (Abiotic) |
| Michigan Probe | Silicon, Platinum/Iridium | 1-64 shanks | 0.5-2 MΩ | Custom layouts, laminar recording | Fracture (Abiotic), Delamination (Abiotic) |
| Neuropixels | Silicon, Platinum/TiN | 960-13824 | ~100 kΩ | Ultra-high channel count, integrated CMOS | Reference electrode drift (Biotic/Abiotic), Probe drift (Biotic) |
| Flexible (Emerging) | Parylene, Polyimide, Graphene, CNTs | Varies | 0.5-5 MΩ (geometric dep.) | Tissue compliance, reduced FBR | Polymer degradation (Abiotic), High impedance (Abiotic) |
Table 2: Common Failure Modes & Diagnostic Tests
| Failure Mode | Primary Type | Symptoms | Diagnostic Test |
|---|---|---|---|
| Fibrous Encapsulation | Biotic | Rising impedance, attenuated signals | Impedance Spectroscopy, Histology (Masson's Trichrome) |
| Neuronal Loss | Biotic | Reduced unit yield, loss of evoked response | Histology (Nissl, NeuN) |
| Metal Corrosion | Abiotic | Increased noise, loss of CIC, particle release | Cyclic Voltammetry, SEM/EDX |
| Insulation Delamination | Abiotic | Cross-talk, shorting, erratic signals | Leakage Current Test, Optical Inspection |
| Mechanical Fracture | Abiotic | Complete signal loss on channels | Microscopy, Electrical Continuity Test |
Experimental Protocols
Protocol 1: Impedance Spectroscopy for In-Vivo Electrode Health Monitoring
- Objective: Measure electrochemical impedance to track biotic fouling or abiotic degradation.
- Equipment: Potentiostat/Galvanostat with FRA, or dedicated neural impedance tester.
- Procedure: a. Connect working electrode to implanted electrode, counter and reference to skull screw/saline bridge. b. Apply a 10 mV RMS sinusoidal signal, sweeping frequency from 1 Hz to 100 kHz. c. Record impedance magnitude (|Z|) and phase (θ). d. Fit data to a modified Randles circuit model to extract interface capacitance and charge transfer resistance.
- Analysis: Plot Bode (|Z| vs. freq) and Nyquist plots. A sustained increase in |Z| at 1 kHz indicates encapsulation.
Protocol 2: Histological Verification of Foreign Body Response
- Objective: Quantify glial scarring and neuronal density around implant.
- Perfusion & Fixation: Transcardially perfuse with 4% paraformaldehyde (PFA).
- Sectioning: Extract brain, cryoprotect in 30% sucrose, section (30 µm) on a cryostat.
- Staining: Use free-floating sections. Perform immunofluorescence: a. Primary Antibodies: Rabbit anti-Iba1 (microglia), Mouse anti-GFAP (astrocytes), Guinea pig anti-NeuN (neurons). b. Secondary Antibodies: Alexa Fluor 488, 568, and 647.
- Imaging & Analysis: Confocal microscopy. Use ImageJ to measure fluorescence intensity profiles as a function of distance from the implant track.
Diagrams
Title: Foreign Body Response Leading to Signal Degradation
Title: Diagnostic Workflow for Neural Electrode Failure
The Scientist's Toolkit: Research Reagent Solutions
| Item | Function | Example/Note |
|---|---|---|
| Parylene-C | Biostable polymer insulation for Michigan probes & flexible arrays. Provides moisture barrier. | Vapor deposition coating. Thickness (1-10 µm) is critical for flexibility vs. integrity. |
| Iridium Oxide (IrOx) | High charge injection capacity coating for stimulating electrodes. | Formed via electrochemical activation of Ir metal (AIROF) or sputtering (SIROF). |
| Dexamethasone | Anti-inflammatory corticosteroid used to mitigate foreign body response. | Loaded into PLLA coatings or released from PLGA microspheres near implant site. |
| PEDOT:PSS | Conductive polymer coating. Lowers impedance, improves signal-to-noise ratio. | Electrodeposited on metal sites. Stability under chronic stimulation is a research focus. |
| Hydrogel Coatings | Soft interfacial layer (e.g., PEG, Hyaluronic Acid). Reduces mechanical mismatch. | Can be cross-linked in situ. May be doped with bioactive molecules (e.g., CD47). |
| Cyclic Voltammetry Setup | Potentiostat, PBS, Ag/AgCl reference electrode. | Critical for measuring charge injection capacity and monitoring electrode health. |
| Iba1 & GFAP Antibodies | Immunohistochemical markers for microglia and astrocytes, respectively. | Standard for quantifying glial scarring in tissue sections. |
Troubleshooting Guide & FAQs
Q1: Our chronically implanted neural electrode exhibits a significant increase in electrochemical impedance magnitude at 1 kHz over four weeks. What are the likely biotic vs. abiotic failure modes, and how can we quantify them? A: A sustained rise in |Z|1kHz typically indicates a failure at the electrode-tissue interface.
- Primary Biotic Mode: Encapsulating glial scar formation (astrogliosis, microgliosis). This adds a resistive layer.
- Primary Abiotic Mode: Insulation delamination or cracking, leading to reduced effective surface area.
- Quantification Protocol:
- Histological: Post-explanation, immunostain for GFAP (astrocytes), Iba1 (microglia), and NeuN (neurons). Calculate the Glibotic Index (Astrocyte + Microglia density / Neuron density within a 100µm radius).
- Electrochemical: Perform a full electrochemical impedance spectroscopy (EIS) sweep (10 Hz - 100 kHz, 10 mV RMS). Fit data to a modified Randles circuit model to separate solution resistance (Rs), tissue encapsulation resistance (Rencap), and charge transfer resistance (Rct).
Q2: During in vivo electrophysiology, our signal-to-noise ratio (SNR) has degraded, and we suspect increased thermal noise. What abiotic factors should we check? A: Increased thermal noise (Johnson-Nyquist noise) is proportional to sqrt(4kTRΔf). An increase suggests a rise in impedance (R).
- Troubleshooting Steps:
- Perform a bench-top saline test (0.9% PBS, 37°C) to isolate abiotic failure. Compare fresh vs. explanted electrode |Z|.
- Inspect interconnects and head-cap connections for corrosion (abiotic electrochemical corrosion) or cracking. Use scanning electron microscopy (SEM) post-explanation.
- Check for insulation breach: Use a fluid cell with a dye (e.g., Evan's Blue) under pressure while observing under a microscope.
Q3: We observe inconsistent functional outcomes (evoked potential amplitude) across subjects with identical electrodes. How do we decouple biotic variability from electrode performance? A: This requires a multi-modal assessment to establish causality.
- Protocol: Implement a within-subject, longitudinal control.
- Functional Metric: Record evoked compound action potential (ECAP) amplitude daily at a fixed, sub-threshold stimulus current.
- Electrochemical Metric: Measure the Charge Storage Capacity (CSC) via cyclic voltammetry (CV) at -0.6V to 0.8V vs. Ag/AgCl, 50 mV/s, in PBS weekly.
- Analysis: Plot ECAP vs. CSC over time. A correlated decline points to abiotic electrode failure. A stable CSC but declining ECAP suggests biotic failure (neuronal loss/degeneration).
Q4: Our polymer-based electrode insulation is showing signs of hydrolytic degradation in vitro. What accelerated aging tests and metrics are relevant? A: Use ASTM F1980-based accelerated aging in phosphate-buffered saline (PBS) at elevated temperatures.
- Key Metrics & Table:
| Test | Protocol | Quantitative Metric | Failure Threshold (Example) |
|---|---|---|---|
| Water Absorption | 48hr immersion, 37°C | Mass Change % | >5% indicates high uptake |
| Adhesion Strength | Tape peel test (ASTM D3359) | % Insulation Remaining | <95% remaining |
| Dielectric Strength | Leakage current @ 5V in PBS | Current (nA) | >100 nA indicates breach |
| Molecular Weight | Gel Permeation Chromatography (GPC) | Mn, Mw Reduction | >20% Mn loss |
Experimental Protocols
Protocol 1: Quantifying Glial Scar Formation (Histological Outcome)
- Perfusion & Sectioning: Transcardially perfuse with 4% PFA. Extract brain, post-fix, cryoprotect, and section (40µm) on a cryostat.
- Immunohistochemistry: Free-floating sections. Block, incubate in primary antibodies (chicken anti-GFAP 1:1000, rabbit anti-Iba1 1:500, mouse anti-NeuN 1:500) for 48h at 4°C. Use appropriate fluorescent secondary antibodies.
- Imaging & Analysis: Confocal microscopy. Acquire z-stacks centered on the implant track. Using ImageJ/Fiji, define concentric circles (0-50µm, 50-100µm from track). Calculate cell density (cells/mm²) for each marker per zone. Compute Glibotic Index = (GFAP+ density + Iba1+ density) / NeuN+ density for the 0-100µm region.
Protocol 2: Electrochemical Impedance Spectroscopy (EIS) for Interface Health
- Setup: Use a 3-electrode cell (working = neural electrode, counter = Pt mesh, reference = Ag/AgCl) in 1x PBS, 37°C.
- Measurement: Apply a 10 mV RMS sinusoidal perturbation from 100 kHz to 0.1 Hz. Use an Autolab or Gamry potentiostat.
- Model Fitting: Fit the Nyquist plot to an equivalent circuit: [Rs([Rencap([RctCPEdl]CPEencap)])]. Report Rs (Ω), Rencap (kΩ), and CPEencap (constant phase element for tissue).
Protocol 3: In Vivo Functional Charge Injection Limit Test
- Stimulation: Use a biphasic, cathodic-first, charge-balanced pulse (200µs/phase) on the implanted electrode.
- Recording: Increase charge density stepwise from 10 to 150 µC/cm² (geometric). Record neural activity on adjacent electrodes.
- Endpoint: The functional charge injection limit is defined as the charge density before the appearance of significant hydrogen evolution (voltage transient exceeding -0.6 V vs. Ag/AgCl) or a reduction in evoked response fidelity (>50% amplitude drop).
Visualization
Diagram Title: Neural Electrode Failure Mode & Metric Relationships
The Scientist's Toolkit: Research Reagent Solutions
| Item | Function in Neural Electrode Research |
|---|---|
| Anti-GFAP Antibody | Labels reactive astrocytes for quantifying glial scar formation (biotic failure). |
| Anti-Iba1 Antibody | Labels activated microglia/macrophages for assessing neuroinflammatory response. |
| Anti-NeuN Antibody | Labels neuronal nuclei to quantify neuronal density and health near the implant. |
| Phosphate Buffered Saline (PBS) | Standard electrolyte for in vitro electrochemical testing (EIS, CV) and accelerated aging. |
| Paraformaldehyde (4% PFA) | Standard fixative for histology to preserve tissue morphology post-explanation. |
| Sucrose (30% in PBS) | Cryoprotectant for brain tissue prior to sectioning on a cryostat. |
| Poly-D-Lysine/Laminin | Coating for cell culture studies of neuronal growth on electrode materials. |
| Hydrogen Peroxide (H₂O₂, 30%) | Used for piranha solution cleaning of electrode surfaces pre-modification. |
| Iridium Oxide Sputtering Target | Source material for depositing high charge-capacity coating (abiotic performance enhancer). |
| Parylene-C dimer | Precursor for vapor-deposited, conformal, biocompatible insulation barrier. |
Technical Support Center: Troubleshooting In Vitro Durability Testing for Neural Electrodes
Introduction: This support center provides guidance for researchers troubleshooting experiments designed to correlate in vitro durability tests with in vivo performance of neural electrodes. The content is framed within a thesis addressing the biotic (e.g., glial scarring, inflammation) and abiotic (e.g., insulation delamination, metal corrosion) failure modes that limit chronic implant functionality.
FAQs & Troubleshooting Guides
Q1: Our accelerated impedance soak test (AST) in PBS at 67°C shows stable performance, but the same electrode fails in vivo within 4 weeks due to increased impedance. What biotic factors are we missing? A: This discrepancy highlights a classic oversight of biotic failure modes. The ASTM F2129 standard ASTM F2129 electrochemical test for corrosion in PBS is an abiotic control. You must incorporate biotic simulation.
- Troubleshooting Protocol: Implement an in vitro glial cell culture model. Plate primary rat astrocytes or a glial cell line (e.g., C8-D1A) on your electrode array. After confluence, stimulate with 10 ng/mL TNF-α and 1 µg/mL LPS for 48 hours to induce an activated state. Perform electrochemical impedance spectroscopy (EIS) and cyclic voltammetry (CV) measurements through the cell layer and compare to cell-free controls.
- Key Reagent: Lipopolysaccharide (LPS) & Tumor Necrosis Factor-alpha (TNF-α). Function: Pro-inflammatory agonists to mimic neuroinflammatory response in vitro.
Q2: How do we design an in vitro mechanical fatigue test that correlates with in vivo micro-motion-induced delamination? A: Match the in vivo strain regime and failure mode. Micro-motion at the brain-tissue interface is typically low-frequency and low-magnitude.
- Troubleshooting Protocol:
- Mounting: Pot the electrode in a soft silicone elastomer (PDMS, ~1 MPa modulus) mimicking brain tissue.
- Cycling: Use a micro-indenter or tensile tester to apply cyclic displacement. A typical regime is 50 µm amplitude at 1 Hz for 10 million cycles (simulating ~3 months in vivo).
- Monitoring: Perform optical microscopy (for cracks) and EIS (for insulation integrity) at defined intervals (e.g., every 500k cycles).
- Critical Parameter: Strain amplitude is more critical than force. Calibrate to achieve 0.5-2% strain on the electrode lead.
Q3: Our in vitro reactive oxygen species (ROS) test shows material degradation, but we see no correlation with chronic in vivo foreign body response. What is wrong with our ROS model? A: The concentration and species of ROS may be non-physiological. The chronic inflammatory zone involves sustained, lower levels of specific oxidants.
- Troubleshooting Protocol: Replace bolus H₂O₂ addition with a continuous, enzymatic ROS generation system.
- Solution: 10 mM glucose, 10 µg/mL glucose oxidase (GOx), and 0.1 U/mL horseradish peroxidase (HRP) in PBS.
- Mechanism: GOx continuously generates H₂O₂ from glucose, while HRP can generate other reactive species. This creates a steady-state ROS environment.
- Exposure: Immerse electrodes in this solution at 37°C for 2-4 weeks, refreshing solution every 48 hours. Compare to PBS-only controls via surface analysis (XPS, SEM).
Q4: What is a critical checklist for validating any in vitro to in vivo correlation study? A:
- Match Failure Mode: Are you testing corrosion but the in vivo failure is mechanical delamination?
- Include Biological Components: Use relevant cell types (astrocytes, microglia, neurons) in co-culture.
- Use Relevant Metrics: EIS, CV, and Charge Storage Capacity (CSC) are functional metrics; SEM/EDX and XPS are material metrics. Track both.
- Employ Accelerated Aging Correctly: Use the Arrhenius model for temperature acceleration only for hydrolysis/oxidation processes, not for mechanical or biotic processes.
Experimental Protocol: Integrated Biotic-Abiotic Accelerated Aging Test
Objective: To simultaneously assess the electrochemical and interfacial stability of neural electrode materials under combined biotic (inflammatory) and abiotic (hydrolytic/oxidative) stress.
Materials:
- Electrode arrays (e.g., PtIr on polyimide, Utah array).
- Cell culture media (DMEM/F12 + 10% FBS).
- Primary mixed glial culture or immortalized microglial cell line (e.g., BV2).
- LPS (1 µg/mL working concentration).
- H₂O₂ (30% stock) for controlled low-dose infusion (e.g., 100 µM final).
- CO₂ incubator at 37°C.
- Potentiostat for EIS/CV.
Methodology:
- Sterilize electrodes (ethylene oxide or UV/ethanol).
- Seed glial cells at confluence on electrodes placed in a culture plate.
- After 24h, activate with LPS-containing media.
- Use a syringe pump to continuously infuse dilute H₂O₂ into the media reservoir (or use GOx/Glucose system from Q3) to maintain a low, chronic ROS level.
- Maintain test for 2-4 weeks. Control groups: (a) Cells + media only, (b) Media + ROS only, (c) Baseline media.
- Perform EIS (1 Hz - 100 kHz, 10 mV RMS) and CV (-0.6V to 0.8V vs. Ag/AgCl, 50 mV/s) weekly.
- Terminate experiment for immunohistochemistry (GFAP, Iba1) on cells and SEM of electrode surfaces.
Data Presentation: Key Metrics from Comparative Studies
Table 1: Correlation of In Vitro Test Outcomes with In Vivo Failure Modes
| In Vitro Test | Key Metric(s) Measured | Correlated In Vivo Failure Mode | Typical Acceleration Factor | Notes |
|---|---|---|---|---|
| Accelerated Impedance Soak (PBS, 67°C) | ||||
| Glial Cell Culture Activation | ||||
| Mechanical Flex (50µm, 1Hz) | ||||
| Enzymatic ROS Generation (GOx/Glucose) |
Table 2: Essential Research Reagent Solutions for In Vitro Durability Models
| Reagent / Material | Function in Durability Testing | Example Supplier / Cat. # (for reference) |
|---|---|---|
| Polyimide-coated Pt/Ir Microelectrodes | Standard test substrate for neural interfaces. | Admatechs / MicroProbes |
| Glucose Oxidase (GOx) from Aspergillus niger | Enzymatic generation of H₂O₂ for chronic oxidative stress modeling. | Sigma-Aldrich, G7141 |
| Lipopolysaccharides (LPS) from E. coli | Potent agonist to induce glial activation and mimic neuroinflammation. | InvivoGen, tlrl-eblps |
| Primary Rat Cortical Astrocytes | Biologically relevant cell model for glial scarring response. | ScienCell Research Labs, #1800 |
| Phosphate Buffered Saline (PBS) for ASTM F2129 | Standard electrolyte for electrochemical corrosion testing. | Various, ASTM-specified |
| Polydimethylsiloxane (PDMS), Sylgard 184 | Soft elastomer for embedding electrodes to simulate brain tissue modulus in mechanical tests. | Dow Chemical |
Visualizations
Diagram 1: Integrated In Vitro Durability Testing Workflow
Diagram 2: Key Signaling in Neuroinflammatory In Vitro Model
Technical Support Center
FAQs & Troubleshooting Guides
Q1: In our rodent model, an electrode recording site shows a sudden, permanent drop in signal amplitude post-implantation. What biotic failure modes should we investigate? A: This typically indicates a severe biotic failure at the electrode-tissue interface. Primary suspects are the foreign body response (FBR) and consequential neuronal loss.
- Troubleshooting Steps:
- Histology Protocol: Perfuse-fix the animal. Section brain tissue (30-40 µm) around the implant. Perform immunofluorescence staining for:
- Neurons: Anti-NeuN (1:500, Millipore MAB377).
- Astrocytes: Anti-GFAP (1:1000, Agilent Z0334).
- Microglia/Macrophages: Anti-Iba1 (1:500, Fujifilm Wako 019-19741).
- Quantitative Analysis: Use image analysis software (e.g., ImageJ) to quantify neuronal density within 50µm, 100µm, and 150µm radii from the electrode track, and the thickness of the glial scar.
- Histology Protocol: Perfuse-fix the animal. Section brain tissue (30-40 µm) around the implant. Perform immunofluorescence staining for:
- Expected Data (Representative Rodent Study):
Q2: During chronic non-human primate (NHP) recordings, we observe gradual signal attenuation over 6 months, followed by complete loss at specific channels. Is this biotic or abiotic failure? A: This progression suggests an initial biotic degradation (glial encapsulation increasing impedance) potentially culminating in an abiotic mechanical failure.
- Troubleshooting Guide:
- Impedance Spectroscopy: Perform daily in vivo measurements at 1 kHz. A steady rise indicates FBR. A sudden spike to open-circuit values suggests wire/connector break.
- Post-Explant Analysis Protocol:
- Visual Inspection: Under microscope, inspect for insulation cracks or conductor fractures.
- Electrical Continuity Test: Use a multimeter to check resistance of each channel from connector to recording site.
- Accelerated Aging Test (for retrieved devices): Subject to 10,000 cycles of mechanical bending (45° angle) in saline; monitor for electrical discontinuity.
Q3: Our clinical trial intracranial EEG (iEEG) macroelectrodes show stable signals, but adjacent microscale Utah array fails prematurely. How do we debug this scale-dependent discrepancy? A: This highlights the critical scaling effect on biotic/abiotic stress. Larger iEEG electrodes have lower charge density and less mechanical mismatch.
- Analysis Workflow:
- Compare the surface area to volume ratio and bending stiffness of the two devices.
- Analyze the implant trajectory: microscale arrays often experience greater shear forces during surgical placement.
- Protocol for Simulating Surgical Stress: In a benchtop model, mount devices per surgical instructions and use force sensors to measure insertion forces. Correlate with device geometry.
Q4: What are the key material failure points for flexible polyimide-based electrodes during validation in moving animal models? A: The primary abiotic failure modes are delamination, metallization trace fracture, and insulation hydration.
- Accelerated Failure Testing Protocol:
- Cyclic Bending Test: Mount electrode on motorized stage, cycling at 2Hz between 0° and 90° bend in PBS at 37°C for 1 million cycles. Monitor electrical continuity.
- Adhesion Test (ASTM D3359): Use cross-hatch tape test on metallization pre/post-soaking in artificial cerebrospinal fluid (aCSF) at 60°C for 1 week.
- Water Vapor Transmission Rate (WVTR) Test: Measure insulation layer WVTR; high rates lead to ionic leakage and short circuits.
The Scientist's Toolkit: Research Reagent Solutions
| Reagent / Material | Function in Neural Electrode Research |
|---|---|
| Poly(3,4-ethylenedioxythiophene) Polystyrene sulfonate (PEDOT:PSS) | Conductive polymer coating to lower electrochemical impedance, improve charge injection capacity. |
| Recombinant IL-1Ra (Anakinra) | Interleukin-1 receptor antagonist used in animal models to pharmacologically suppress neuroinflammatory response. |
| L1 Cell Adhesion Molecule (L1CAM) Coating | Promotes neuronal adhesion and neurite outgrowth on electrode surfaces, potentially mitigating neuronal die-off. |
| Peptide Hydrogel (e.g., RADA16-I) | Injectable, biocompatible scaffold used to coat electrodes or fill implantation cavity, modulating FBR. |
| Artificial Cerebrospinal Fluid (aCSF) | Ionic solution for in vitro electrochemical testing and device soaking, mimicking brain environment. |
| Iridium Oxide (IrOx) | High charge-capacity coating for microelectrodes, enables safe stimulation in chronic settings. |
| Fluorinated Ethylene Propylene (FEP) Insulation | Biostable, high-resistance insulation polymer for chronic implants, resistant to hydration. |
Diagram 1: Neural Electrode Failure Mode Decision Tree
Diagram 2: Translational Validation Workflow
Diagram 3: Key Biotic Signaling Pathways at Interface
Conclusion
The journey toward stable, high-fidelity chronic neural interfaces requires a holistic, multidisciplinary attack on both biotic and abiotic failure fronts. Foundational understanding of the complex interplay between immune response and material degradation is paramount. Methodological innovations in materials science, surface engineering, and device architecture are yielding promising new tools. Effective troubleshooting through in situ diagnostics and adaptive algorithms can extend functional lifetimes, while rigorous, comparative validation is essential for translating laboratory successes into reliable clinical and research tools. Future progress hinges on closed-loop systems that actively manage the interface, the development of truly bio-integrative materials, and standardized, predictive testing frameworks. For researchers and drug developers, overcoming these failure modes is not merely an engineering challenge but a fundamental prerequisite for unlocking the full potential of neural recording and stimulation in understanding the brain and treating its disorders.